This uses the car::placeLabel() function to generate labels for the given scene. Either
use an sf object or manually specify the x/y coordinates and label.
generate_label_overlay(
  labels,
  extent,
  x = NULL,
  y = NULL,
  heightmap = NULL,
  width = NA,
  height = NA,
  resolution_multiply = 1,
  text_size = 1,
  color = "black",
  font = 1,
  pch = 16,
  point_size = 1,
  point_color = NA,
  offset = c(0, 0),
  data_label_column = NULL,
  halo_color = NA,
  halo_expand = 0,
  halo_alpha = 1,
  halo_offset = c(0, 0),
  halo_blur = 0,
  halo_edge_softness = 0.1,
  seed = NA
)
Arguments
- labels
A character vector of labels, or an
sfobject withPOINTgeometry and a column for labels.- extent
Either an object representing the spatial extent of the scene (either from the
raster,terra,sf, orsppackages), a length-4 numeric vector specifyingc("xmin", "xmax","ymin","ymax"), or the spatial object (from the previously aforementioned packages) which will be automatically converted to an extent object.- x
Default
NULL. The x-coordinate, iflabelsis not ansfobject.- y
Default
NULL. The y-coordinate, iflabelsis not ansfobject.- heightmap
Default
NULL. The original height map. Pass this in to extract the dimensions of the resulting overlay automatically.- width
Default
NA. Width of the resulting overlay. Default the same dimensions as height map.- height
Default
NA. Width of the resulting overlay. Default the same dimensions as height map.- resolution_multiply
Default
1. If passing inheightmapinstead of width/height, amount to increase the resolution of the overlay, which should make lines/polygons/text finer. Should be combined withadd_overlay()withrescale_original = TRUEto ensure those added details are captured in the final map.- text_size
Default
1. Text size.- color
Default
black. Color of the labels.- font
Default
1. An integer which specifies which font to use for text. If possible, device drivers arrange so that 1 corresponds to plain text (the default), 2 to bold face, 3 to italic and 4 to bold italic.- pch
Default
20, solid. Point symbol.0= square,1= circle,2= triangle point up,3= plus,4= cross,5= diamond,6= triangle point down,7= square cross,8= star,9= diamond plus,10= circle plus,11= triangles up and down,12= square plus,13= circle cross,14= square and triangle down,15= filled square,16= filled circle,17= filled triangle point-up,18= filled diamond,19= solid circle,20= bullet (smaller circle),21= filled circle blue,22= filled square blue,23= filled diamond blue,24= filled triangle point-up blue,25= filled triangle point down blue- point_size
Default
0, no points. Point size.- point_color
Default
NA. Colors of the points. Unless otherwise specified, this defaults tocolor.- offset
Default
c(0,0). Horizontal and vertical offset to apply to the label, in units ofgeometry.- data_label_column
Default
NULL. The column in thesfobject that contains the labels.- halo_color
Default
NA, no halo. If a color is specified, the text label will be surrounded by a halo of this color.- halo_expand
Default
2. Number of pixels to expand the halo.- halo_alpha
Default
1. Transparency of the halo.- halo_offset
Default
c(0,0). Horizontal and vertical offset to apply to the halo, in units ofgeometry.- halo_blur
Default
0. Amount of blur to apply to the halo. Values greater than30won't result in further blurring.- halo_edge_softness
Default
0.1. Width of the softened halo edge transition, in pixels.- seed
Default
NA, no seed. Random seed for ensuring the consistent placement of labels around points.
Value
Semi-transparent overlay with labels.
Examples
#Add the included `sf` object with roads to the montereybay dataset
if(run_documentation()) {
#Create the water palette
water_palette = colorRampPalette(c("darkblue", "dodgerblue", "lightblue"))(200)
bathy_hs = height_shade(montereybay, texture = water_palette)
#Set label font
par(family = "Arial")
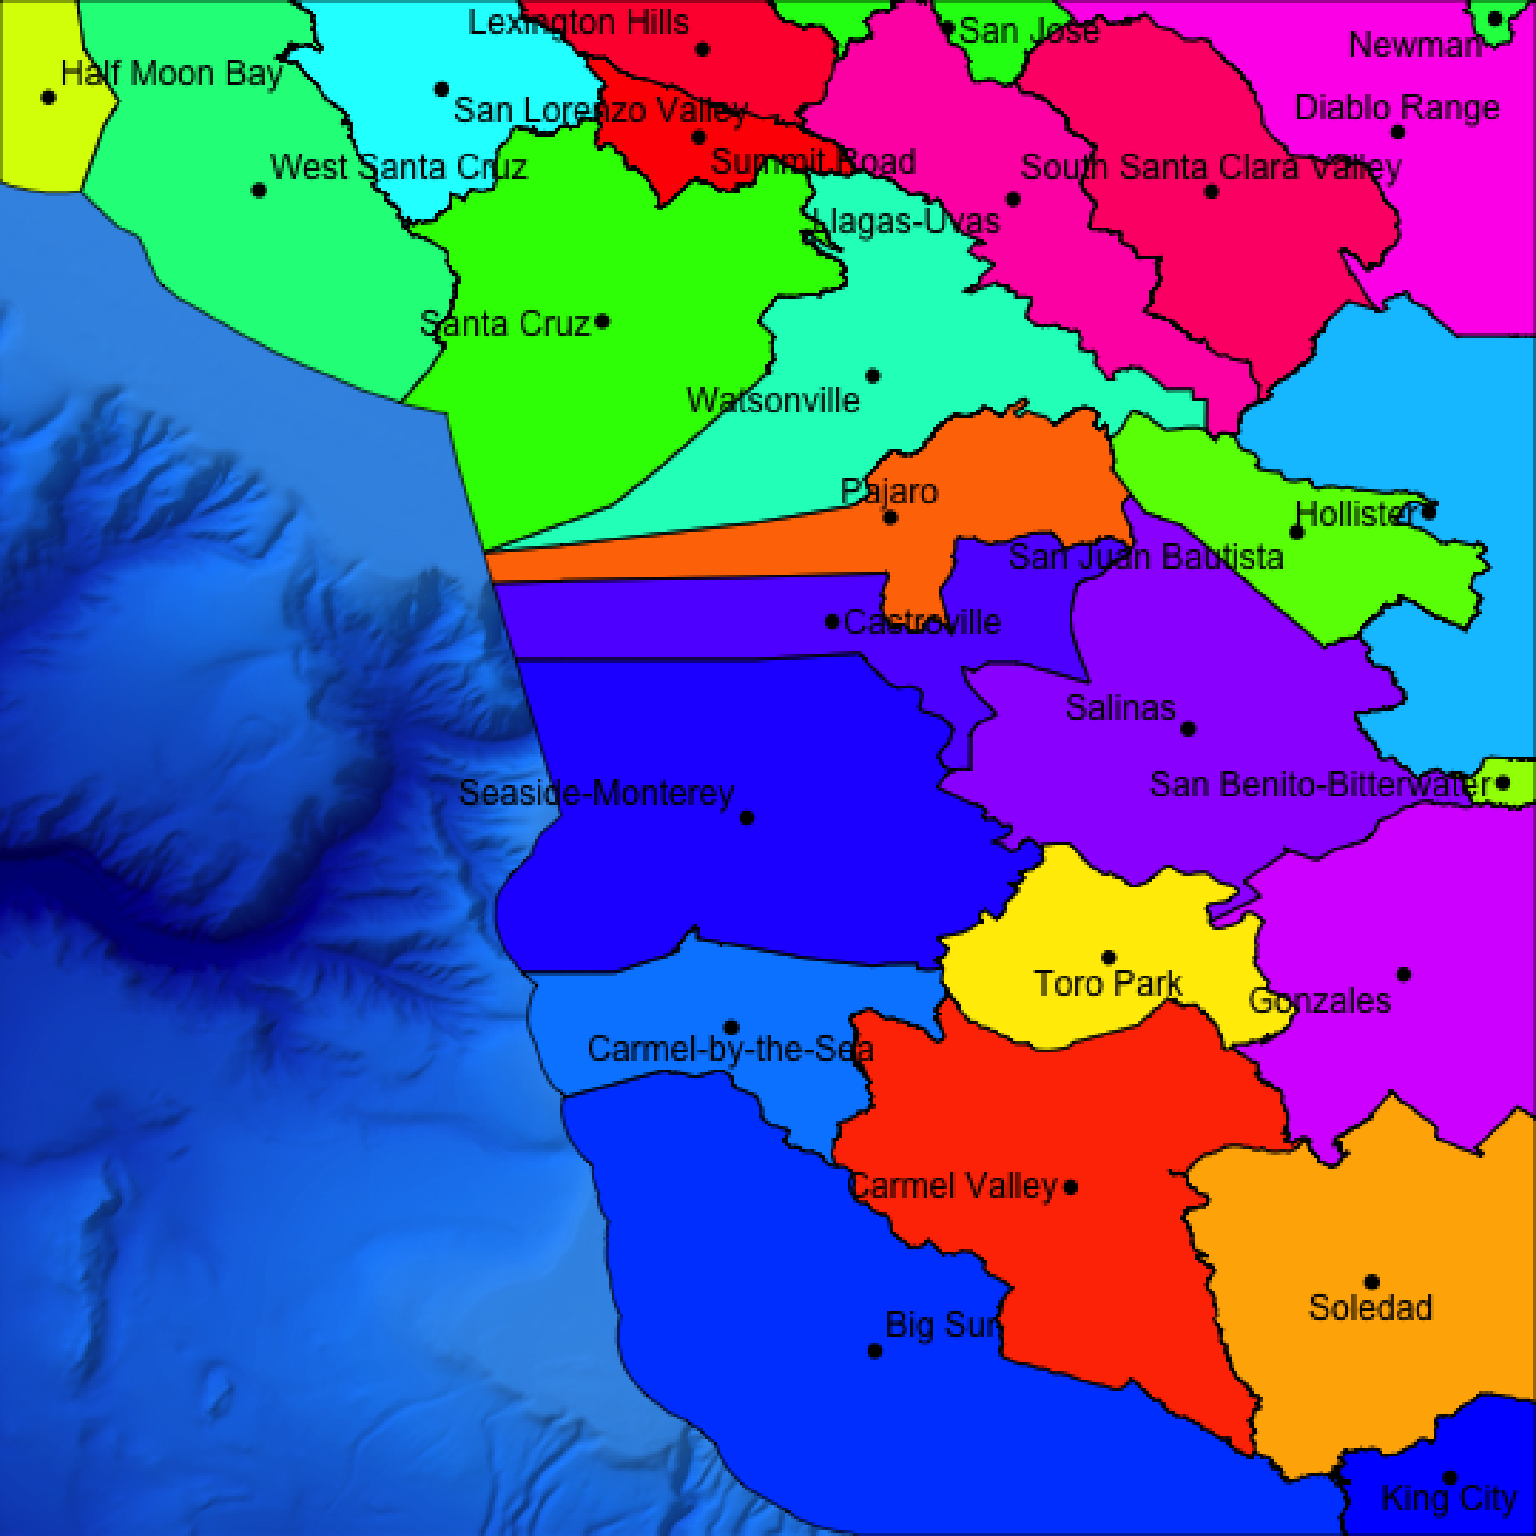
#We're plotting the polygon data here for counties around Monterey Bay. We'll first
#plot the county names at the polygon centroids.
bathy_hs |>
add_shadow(lamb_shade(montereybay,zscale=50),0.3) |>
add_overlay(generate_polygon_overlay(monterey_counties_sf, palette = rainbow,
extent = attr(montereybay,"extent"),
heightmap = montereybay)) |>
add_overlay(generate_label_overlay(labels=monterey_counties_sf,
color="black", point_size = 1, text_size = 1,
data_label_column = "NAME",
extent= attr(montereybay,"extent"), heightmap = montereybay,
seed=1)) |>
plot_map()
}
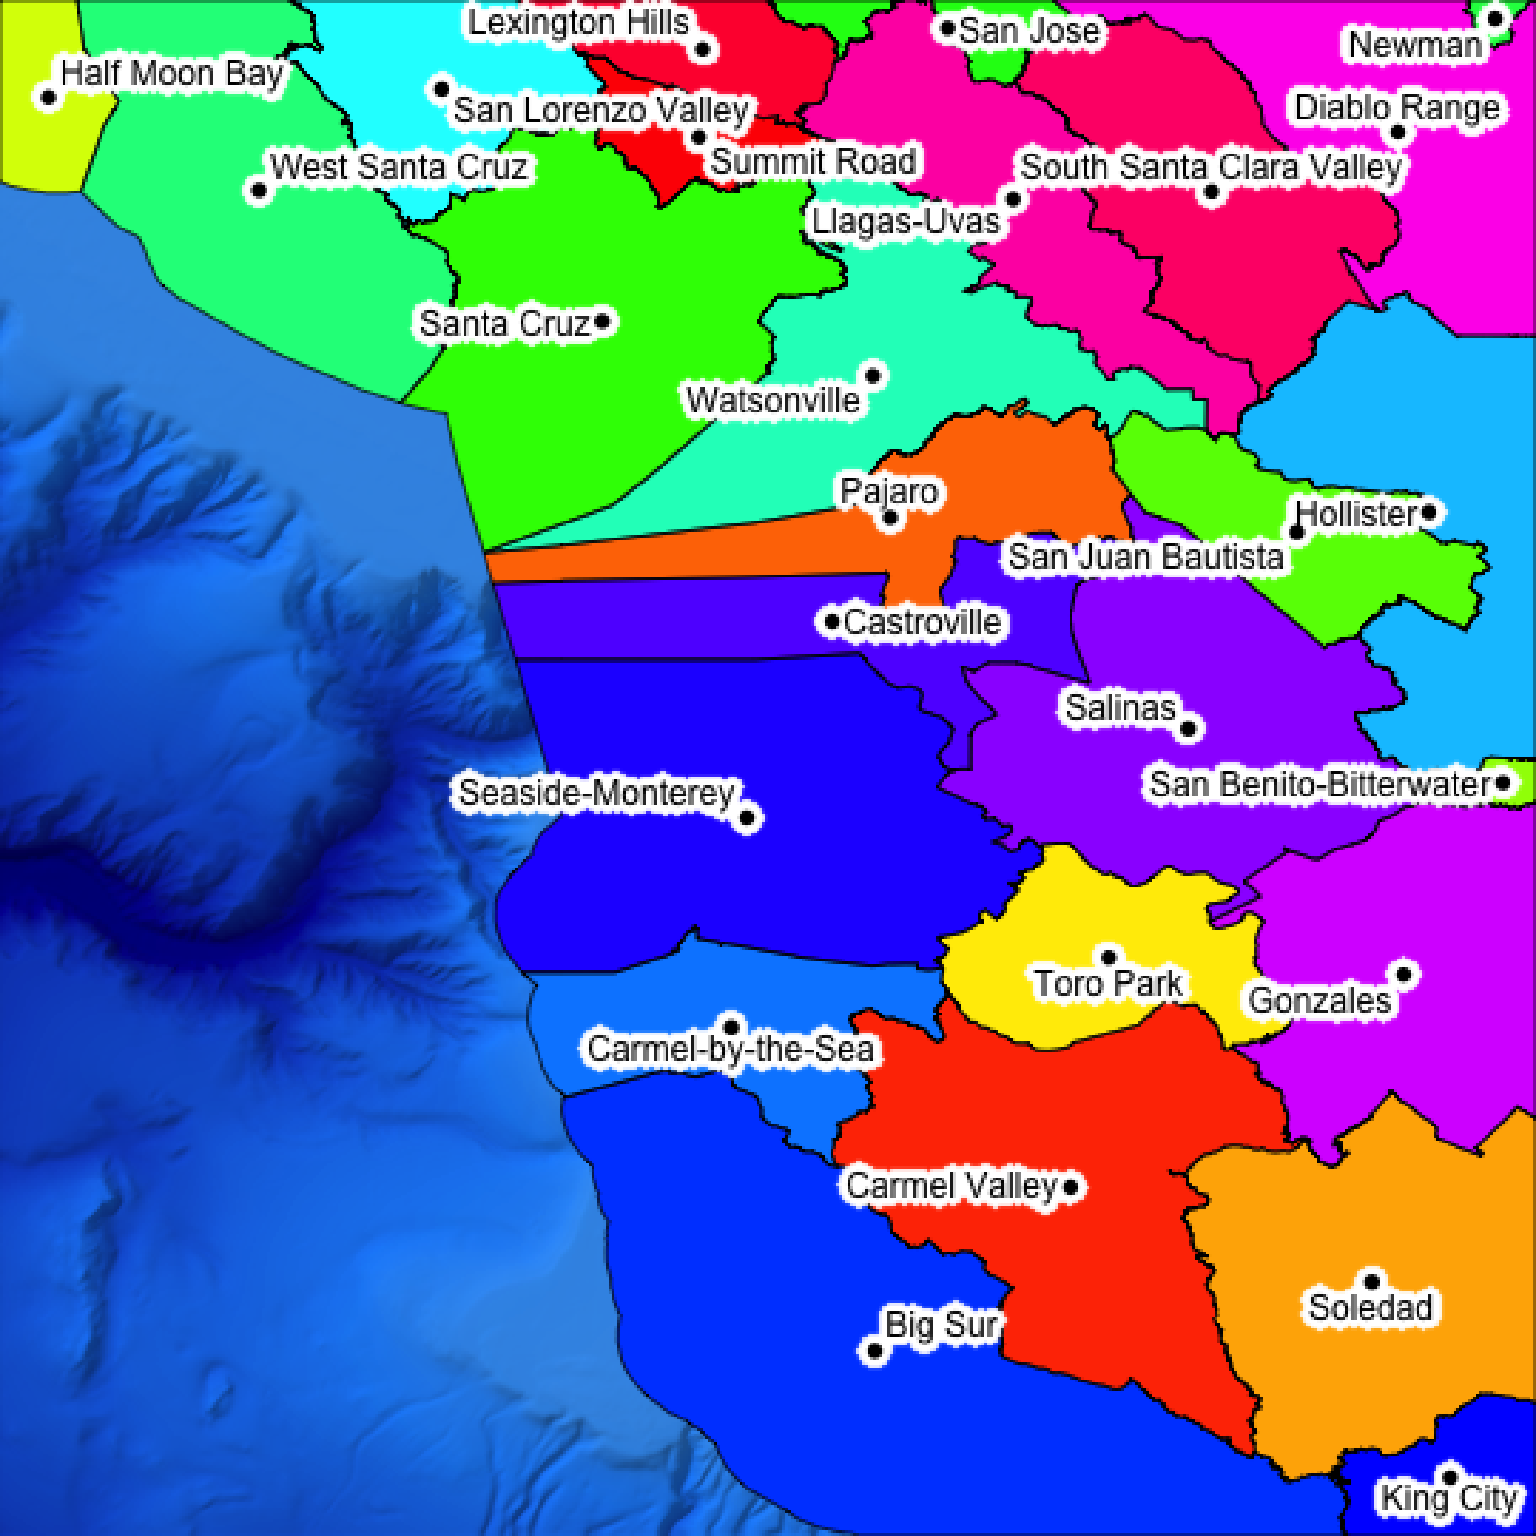
 if(run_documentation()) {
#It's hard to read these values, so we'll add a white halo.
bathy_hs |>
add_shadow(lamb_shade(montereybay,zscale=50),0.3) |>
add_overlay(generate_polygon_overlay(monterey_counties_sf, palette = rainbow,
extent = attr(montereybay,"extent"),
heightmap = montereybay)) |>
add_overlay(generate_label_overlay(labels=monterey_counties_sf,
color="black", point_size = 1, text_size = 1,
data_label_column = "NAME",
extent= attr(montereybay,"extent"), heightmap = montereybay,
halo_color = "white", halo_expand = 3,
seed=1)) |>
plot_map()
}
if(run_documentation()) {
#It's hard to read these values, so we'll add a white halo.
bathy_hs |>
add_shadow(lamb_shade(montereybay,zscale=50),0.3) |>
add_overlay(generate_polygon_overlay(monterey_counties_sf, palette = rainbow,
extent = attr(montereybay,"extent"),
heightmap = montereybay)) |>
add_overlay(generate_label_overlay(labels=monterey_counties_sf,
color="black", point_size = 1, text_size = 1,
data_label_column = "NAME",
extent= attr(montereybay,"extent"), heightmap = montereybay,
halo_color = "white", halo_expand = 3,
seed=1)) |>
plot_map()
}
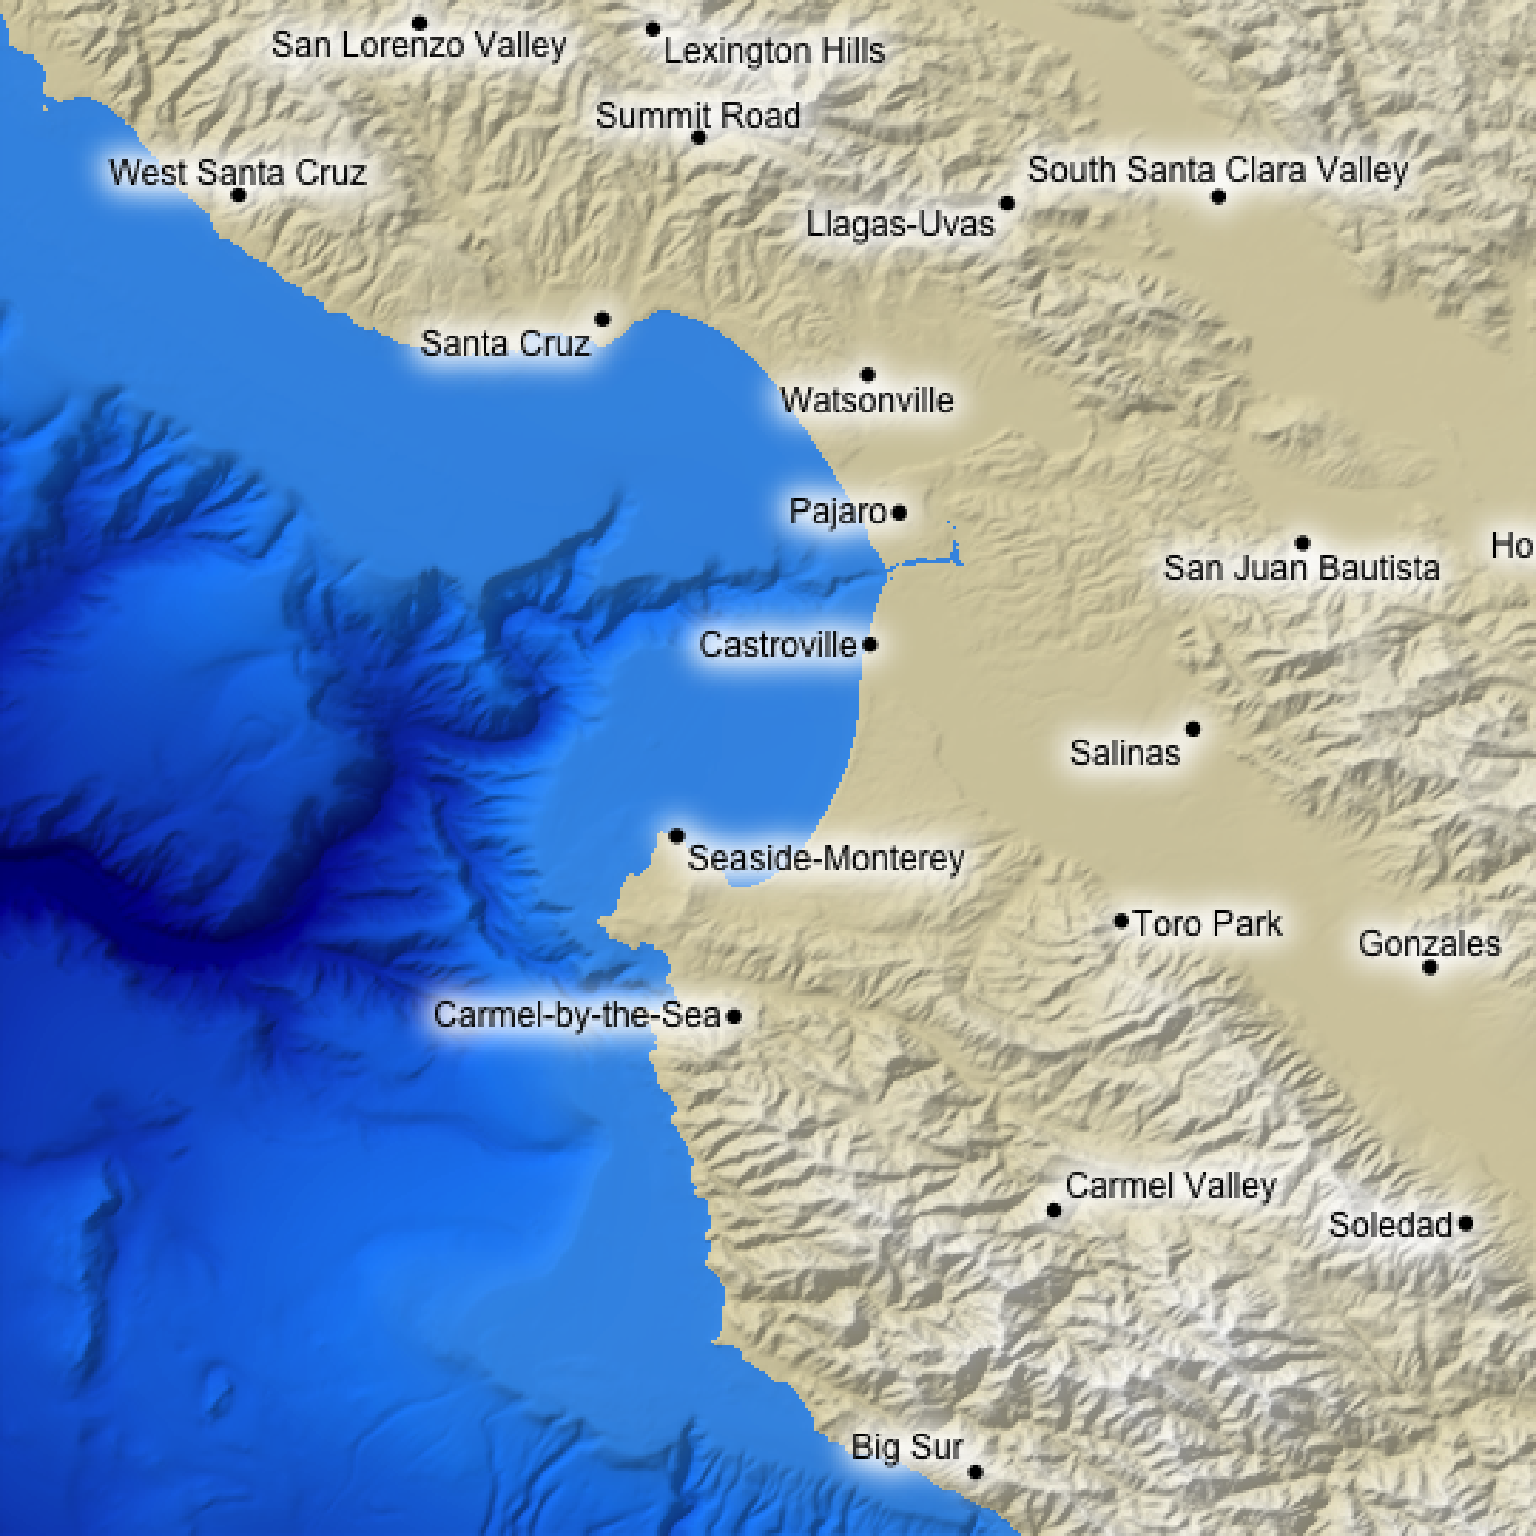
 if(run_documentation()) {
#Plot the actual town locations, using the manual plotting interface instead of the `sf` object
montereybay |>
height_shade() |>
add_overlay(generate_altitude_overlay(bathy_hs, montereybay, 0, 0)) |>
add_shadow(lamb_shade(montereybay,zscale=50),0.3) |>
add_overlay(generate_label_overlay(labels=as.character(monterey_counties_sf$NAME),
x=as.numeric(as.character(monterey_counties_sf$INTPTLON)),
y=as.numeric(as.character(monterey_counties_sf$INTPTLAT)),
color="black", point_size = 1, text_size = 1,
extent= attr(montereybay,"extent"), heightmap = montereybay,
halo_color = "white", halo_expand = 3,
seed=1)) |>
plot_map()
}
if(run_documentation()) {
#Plot the actual town locations, using the manual plotting interface instead of the `sf` object
montereybay |>
height_shade() |>
add_overlay(generate_altitude_overlay(bathy_hs, montereybay, 0, 0)) |>
add_shadow(lamb_shade(montereybay,zscale=50),0.3) |>
add_overlay(generate_label_overlay(labels=as.character(monterey_counties_sf$NAME),
x=as.numeric(as.character(monterey_counties_sf$INTPTLON)),
y=as.numeric(as.character(monterey_counties_sf$INTPTLAT)),
color="black", point_size = 1, text_size = 1,
extent= attr(montereybay,"extent"), heightmap = montereybay,
halo_color = "white", halo_expand = 3,
seed=1)) |>
plot_map()
}
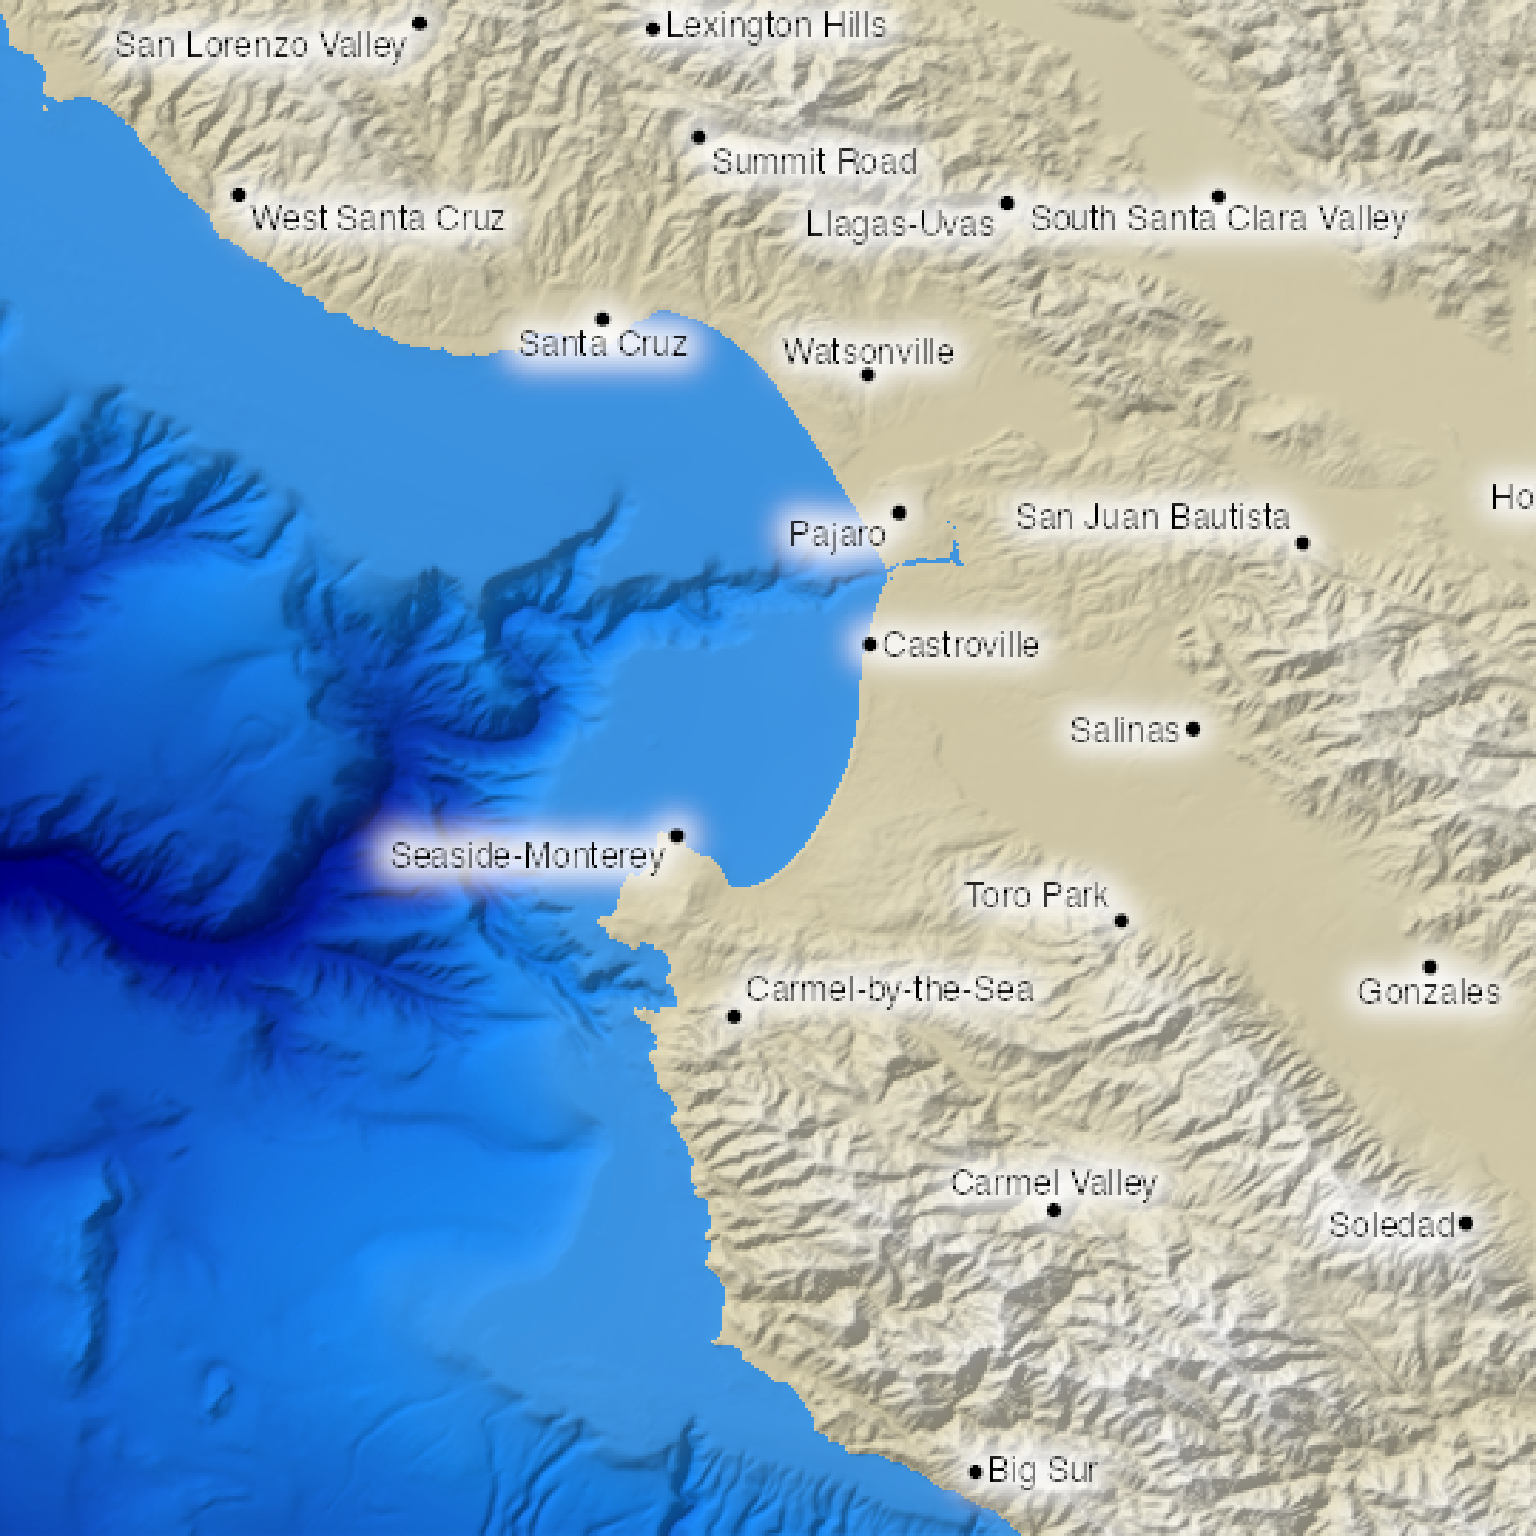
 if(run_documentation()) {
#Adding a softer blurred halo
montereybay |>
height_shade() |>
add_overlay(generate_altitude_overlay(bathy_hs, montereybay, 0, 0)) |>
add_shadow(lamb_shade(montereybay,zscale=50),0.3) |>
add_overlay(generate_label_overlay(labels=as.character(monterey_counties_sf$NAME),
x=as.numeric(as.character(monterey_counties_sf$INTPTLON)),
y=as.numeric(as.character(monterey_counties_sf$INTPTLAT)),
color="black", point_size = 1, text_size = 1,
extent= attr(montereybay,"extent"), heightmap = montereybay,
halo_color = "white", halo_expand = 3, halo_blur=10,
seed=1)) |>
plot_map()
}
if(run_documentation()) {
#Adding a softer blurred halo
montereybay |>
height_shade() |>
add_overlay(generate_altitude_overlay(bathy_hs, montereybay, 0, 0)) |>
add_shadow(lamb_shade(montereybay,zscale=50),0.3) |>
add_overlay(generate_label_overlay(labels=as.character(monterey_counties_sf$NAME),
x=as.numeric(as.character(monterey_counties_sf$INTPTLON)),
y=as.numeric(as.character(monterey_counties_sf$INTPTLAT)),
color="black", point_size = 1, text_size = 1,
extent= attr(montereybay,"extent"), heightmap = montereybay,
halo_color = "white", halo_expand = 3, halo_blur=10,
seed=1)) |>
plot_map()
}
 if(run_documentation()) {
#Changing the seed changes the locations of the labels
montereybay |>
height_shade() |>
add_overlay(generate_altitude_overlay(bathy_hs, montereybay, 0, 0)) |>
add_shadow(lamb_shade(montereybay,zscale=50),0.3) |>
add_overlay(generate_label_overlay(labels=as.character(monterey_counties_sf$NAME),
x=as.numeric(as.character(monterey_counties_sf$INTPTLON)),
y=as.numeric(as.character(monterey_counties_sf$INTPTLAT)),
color="black", point_size = 1, text_size = 1,
extent= attr(montereybay,"extent"), heightmap = montereybay,
halo_color = "white", halo_expand = 3, halo_blur=10,
seed=2)) |>
plot_map()
}
if(run_documentation()) {
#Changing the seed changes the locations of the labels
montereybay |>
height_shade() |>
add_overlay(generate_altitude_overlay(bathy_hs, montereybay, 0, 0)) |>
add_shadow(lamb_shade(montereybay,zscale=50),0.3) |>
add_overlay(generate_label_overlay(labels=as.character(monterey_counties_sf$NAME),
x=as.numeric(as.character(monterey_counties_sf$INTPTLON)),
y=as.numeric(as.character(monterey_counties_sf$INTPTLAT)),
color="black", point_size = 1, text_size = 1,
extent= attr(montereybay,"extent"), heightmap = montereybay,
halo_color = "white", halo_expand = 3, halo_blur=10,
seed=2)) |>
plot_map()
}