Calculates a color for each point on the surface using a direct elevation-to-color mapping.
height_shade(
  heightmap,
  texture = (grDevices::colorRampPalette(c("#6AA85B", "#D9CC9A", "#FFFFFF")))(256),
  range = NULL
)
Arguments
- heightmap
A two-dimensional matrix, where each entry in the matrix is the elevation at that point.
- texture
Default
terrain.colors(256). A color palette for the plot.- range
Default
NULL, the full range of the heightmap. A length-2 vector specifying the maximum and minimum values to map the color palette to.
Value
RGB array of hillshaded texture mappings.
Examples
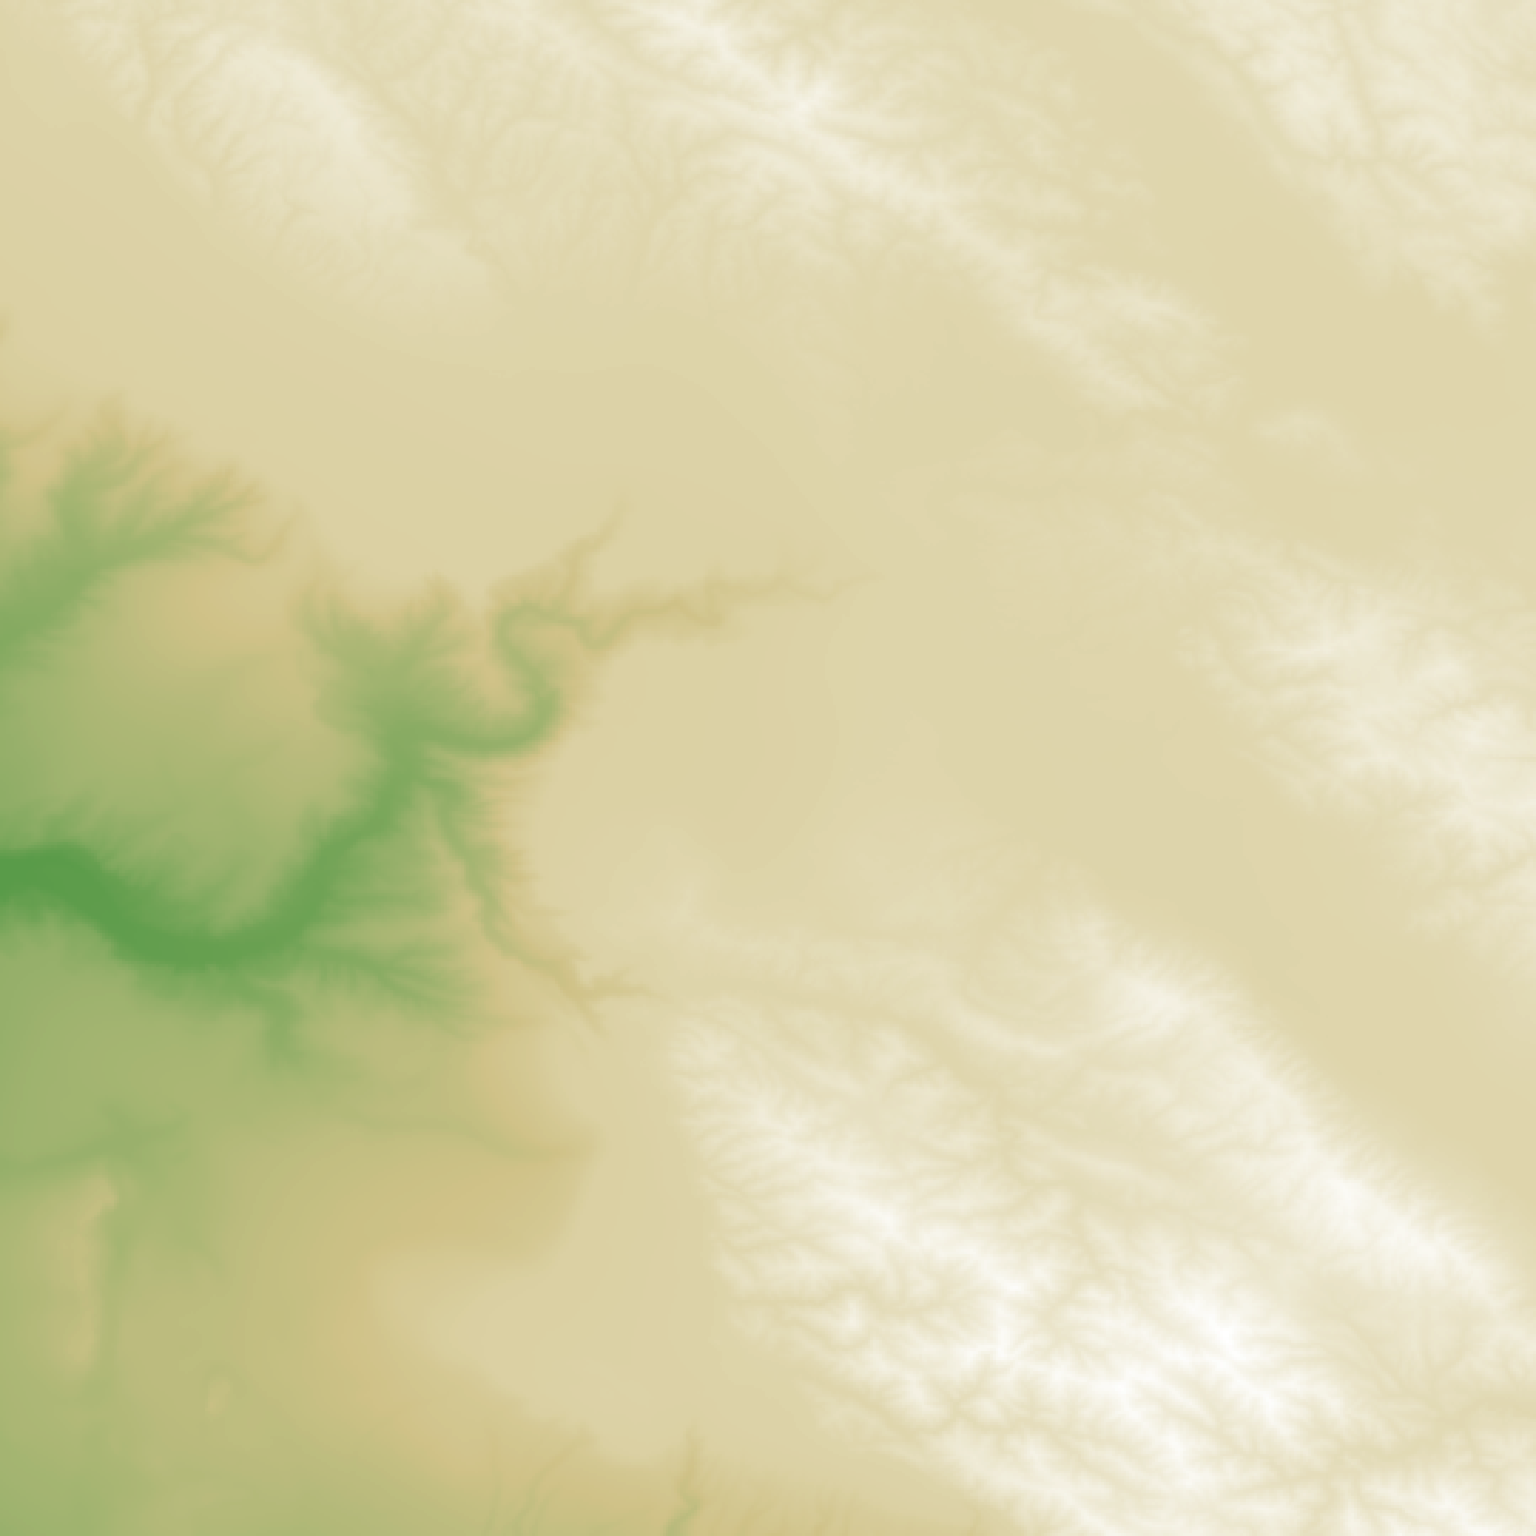
#Create a direct mapping of elevation to color:
montereybay |>
height_shade() |>
plot_map()
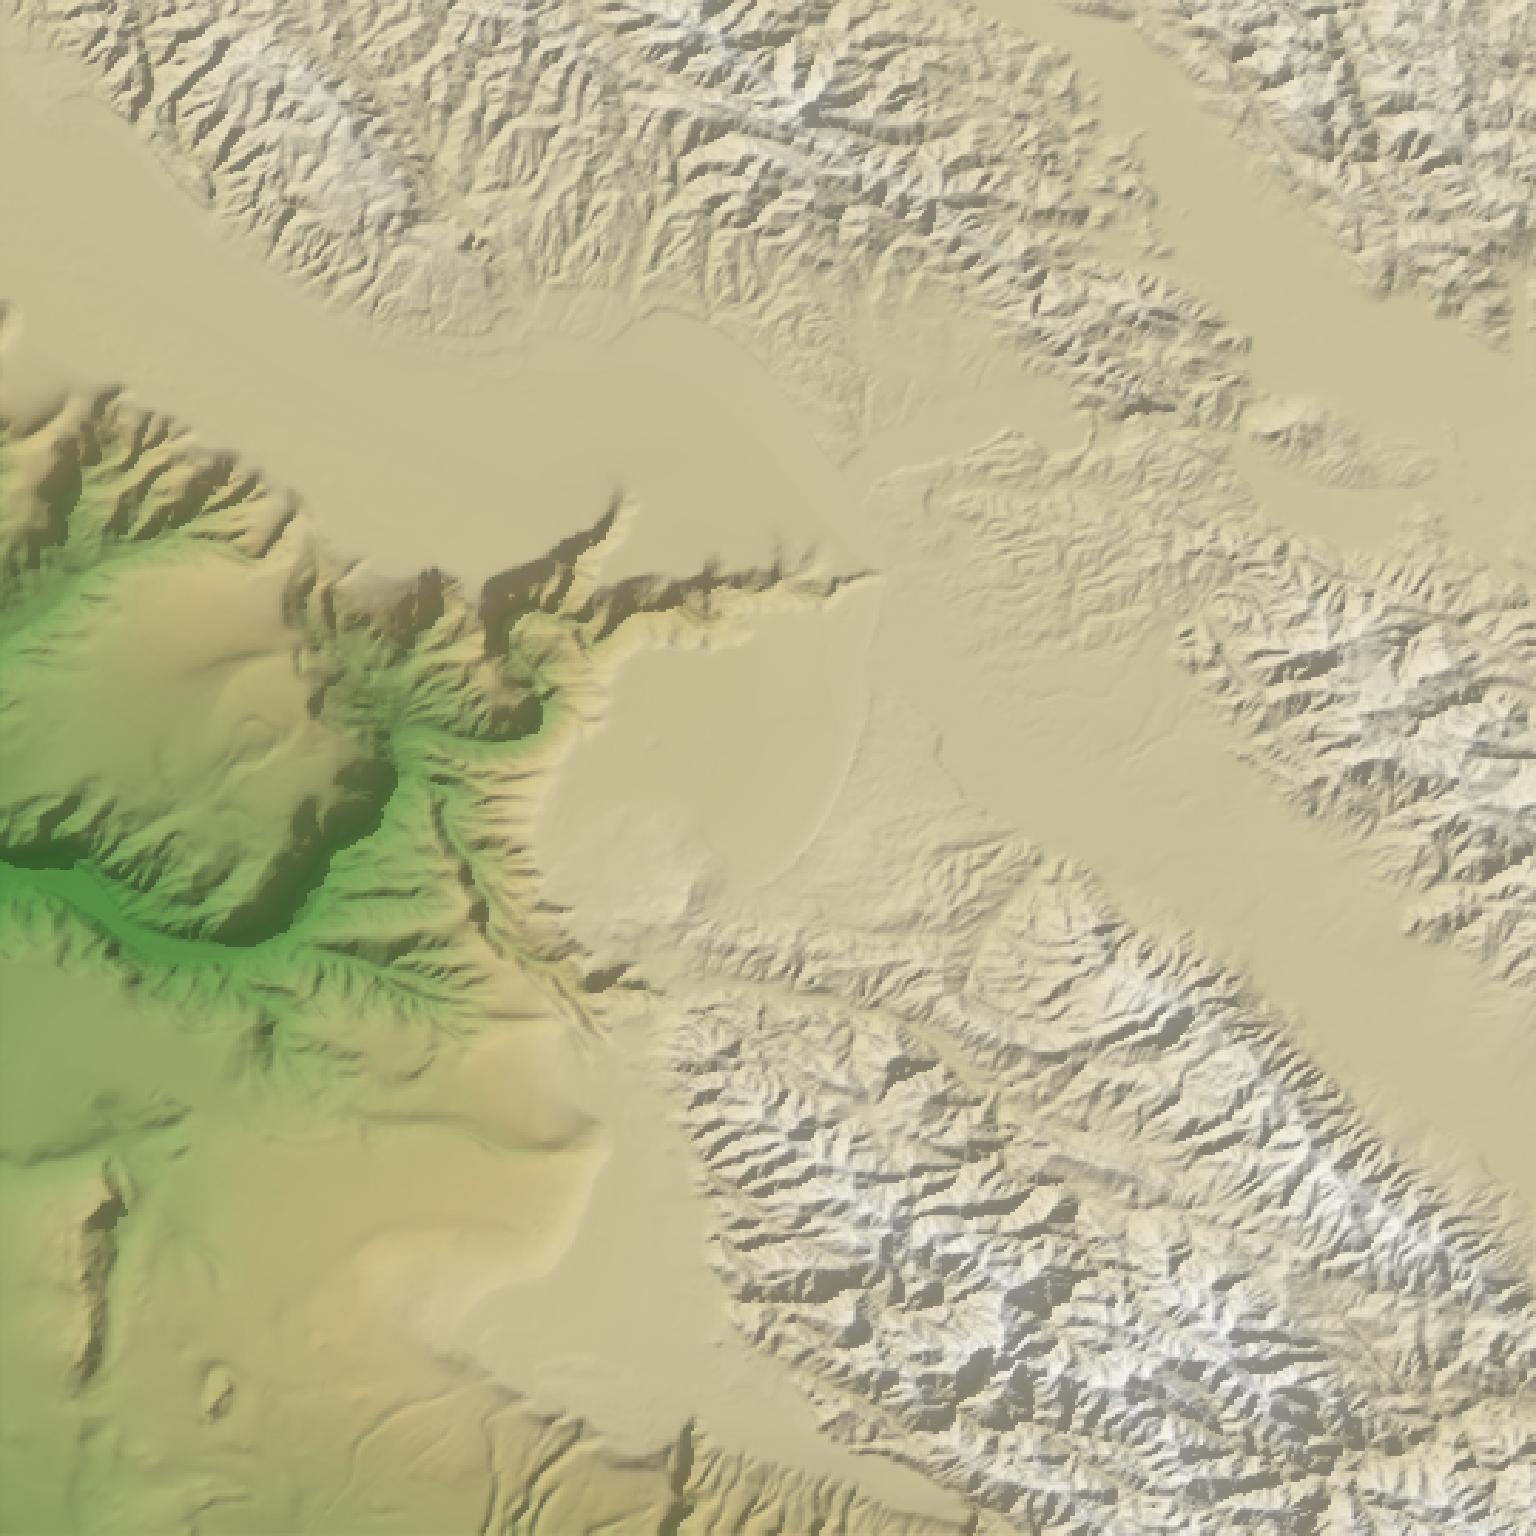
 #Add a shadow:
if(run_documentation()) {
montereybay |>
height_shade() |>
add_shadow(ray_shade(montereybay,zscale=50),0.1) |>
plot_map()
}
#Add a shadow:
if(run_documentation()) {
montereybay |>
height_shade() |>
add_shadow(ray_shade(montereybay,zscale=50),0.1) |>
plot_map()
}
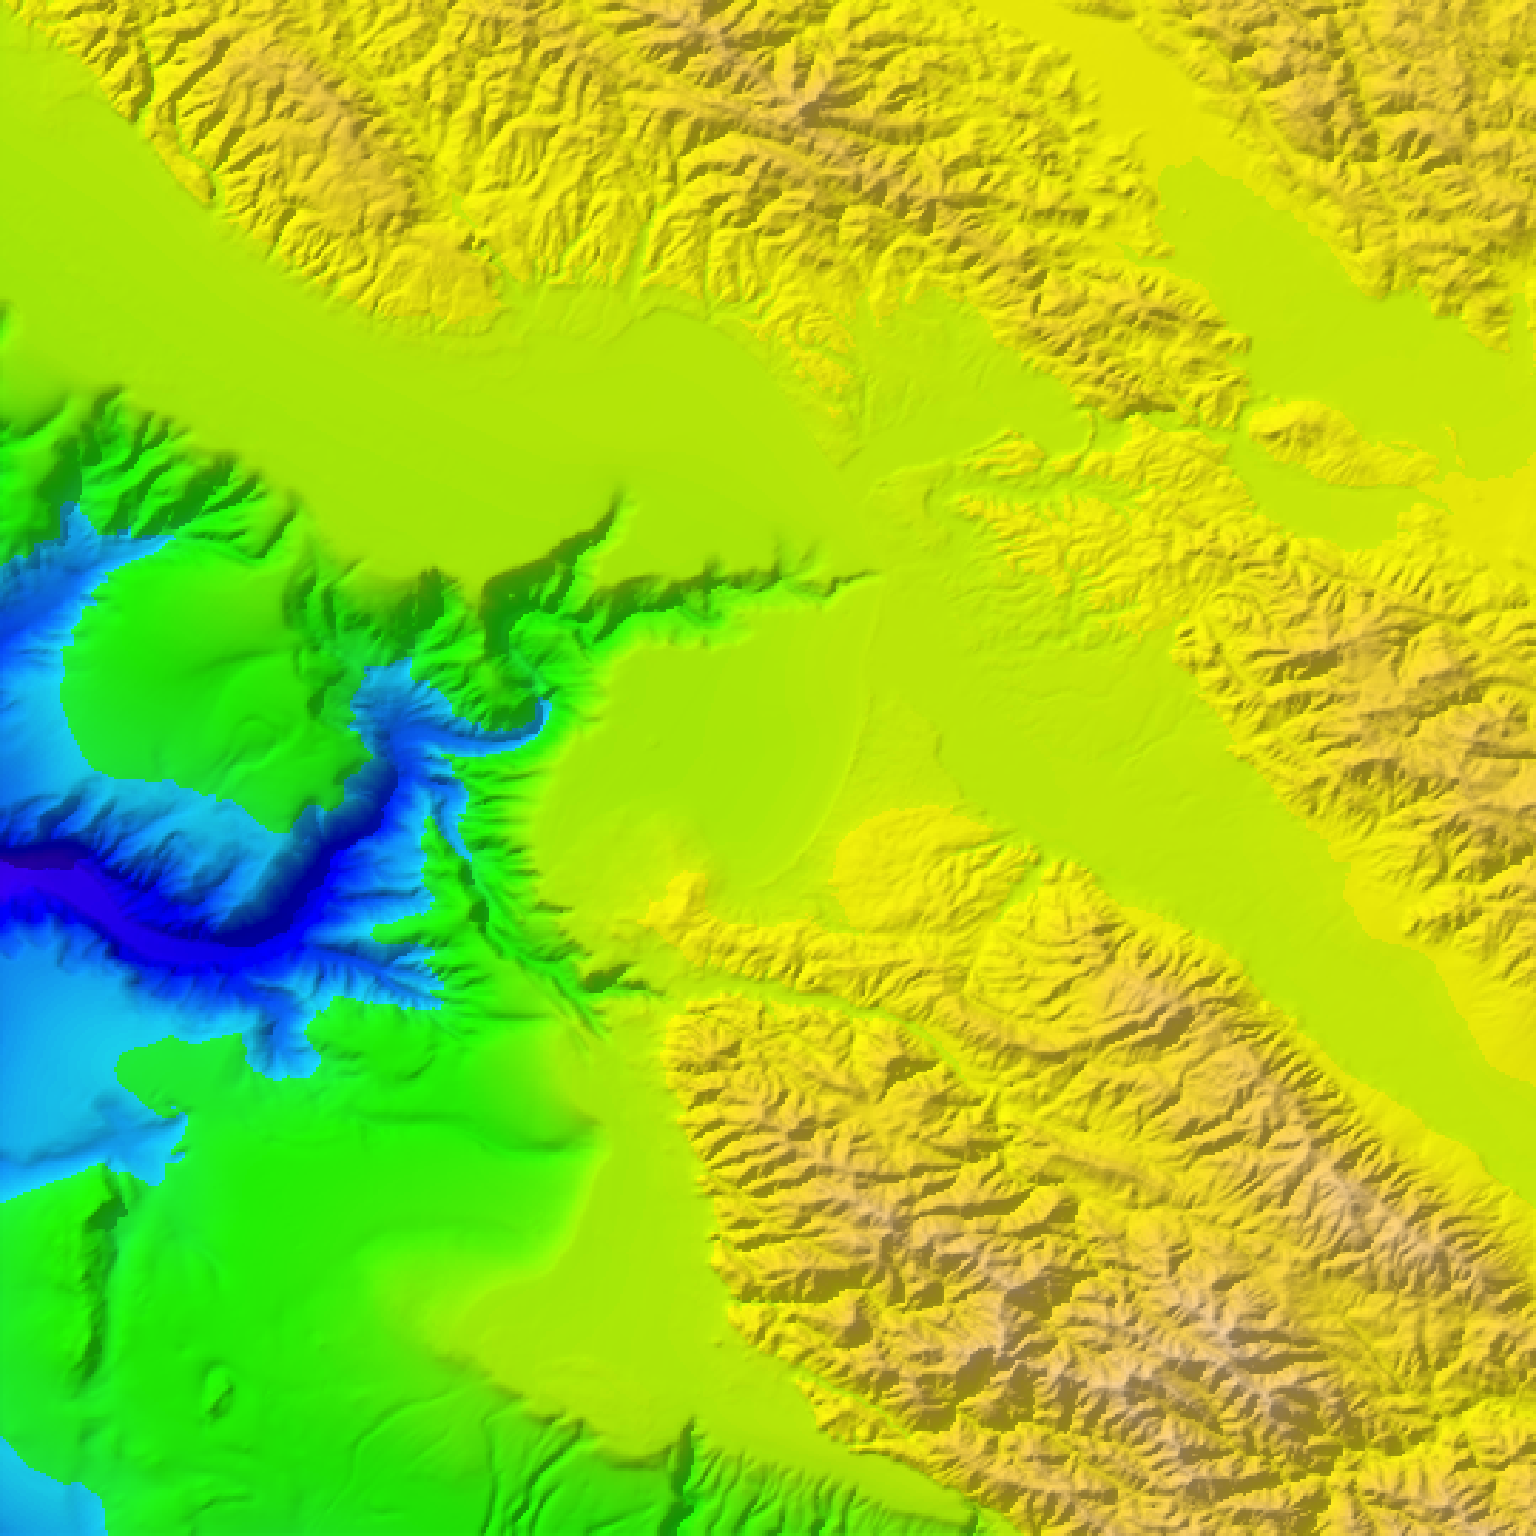
 #Change the palette:
if(run_documentation()) {
montereybay |>
height_shade(texture = topo.colors(256)) |>
add_shadow(ray_shade(montereybay,zscale=50),0.1) |>
plot_map()
}
#Change the palette:
if(run_documentation()) {
montereybay |>
height_shade(texture = topo.colors(256)) |>
add_shadow(ray_shade(montereybay,zscale=50),0.1) |>
plot_map()
}
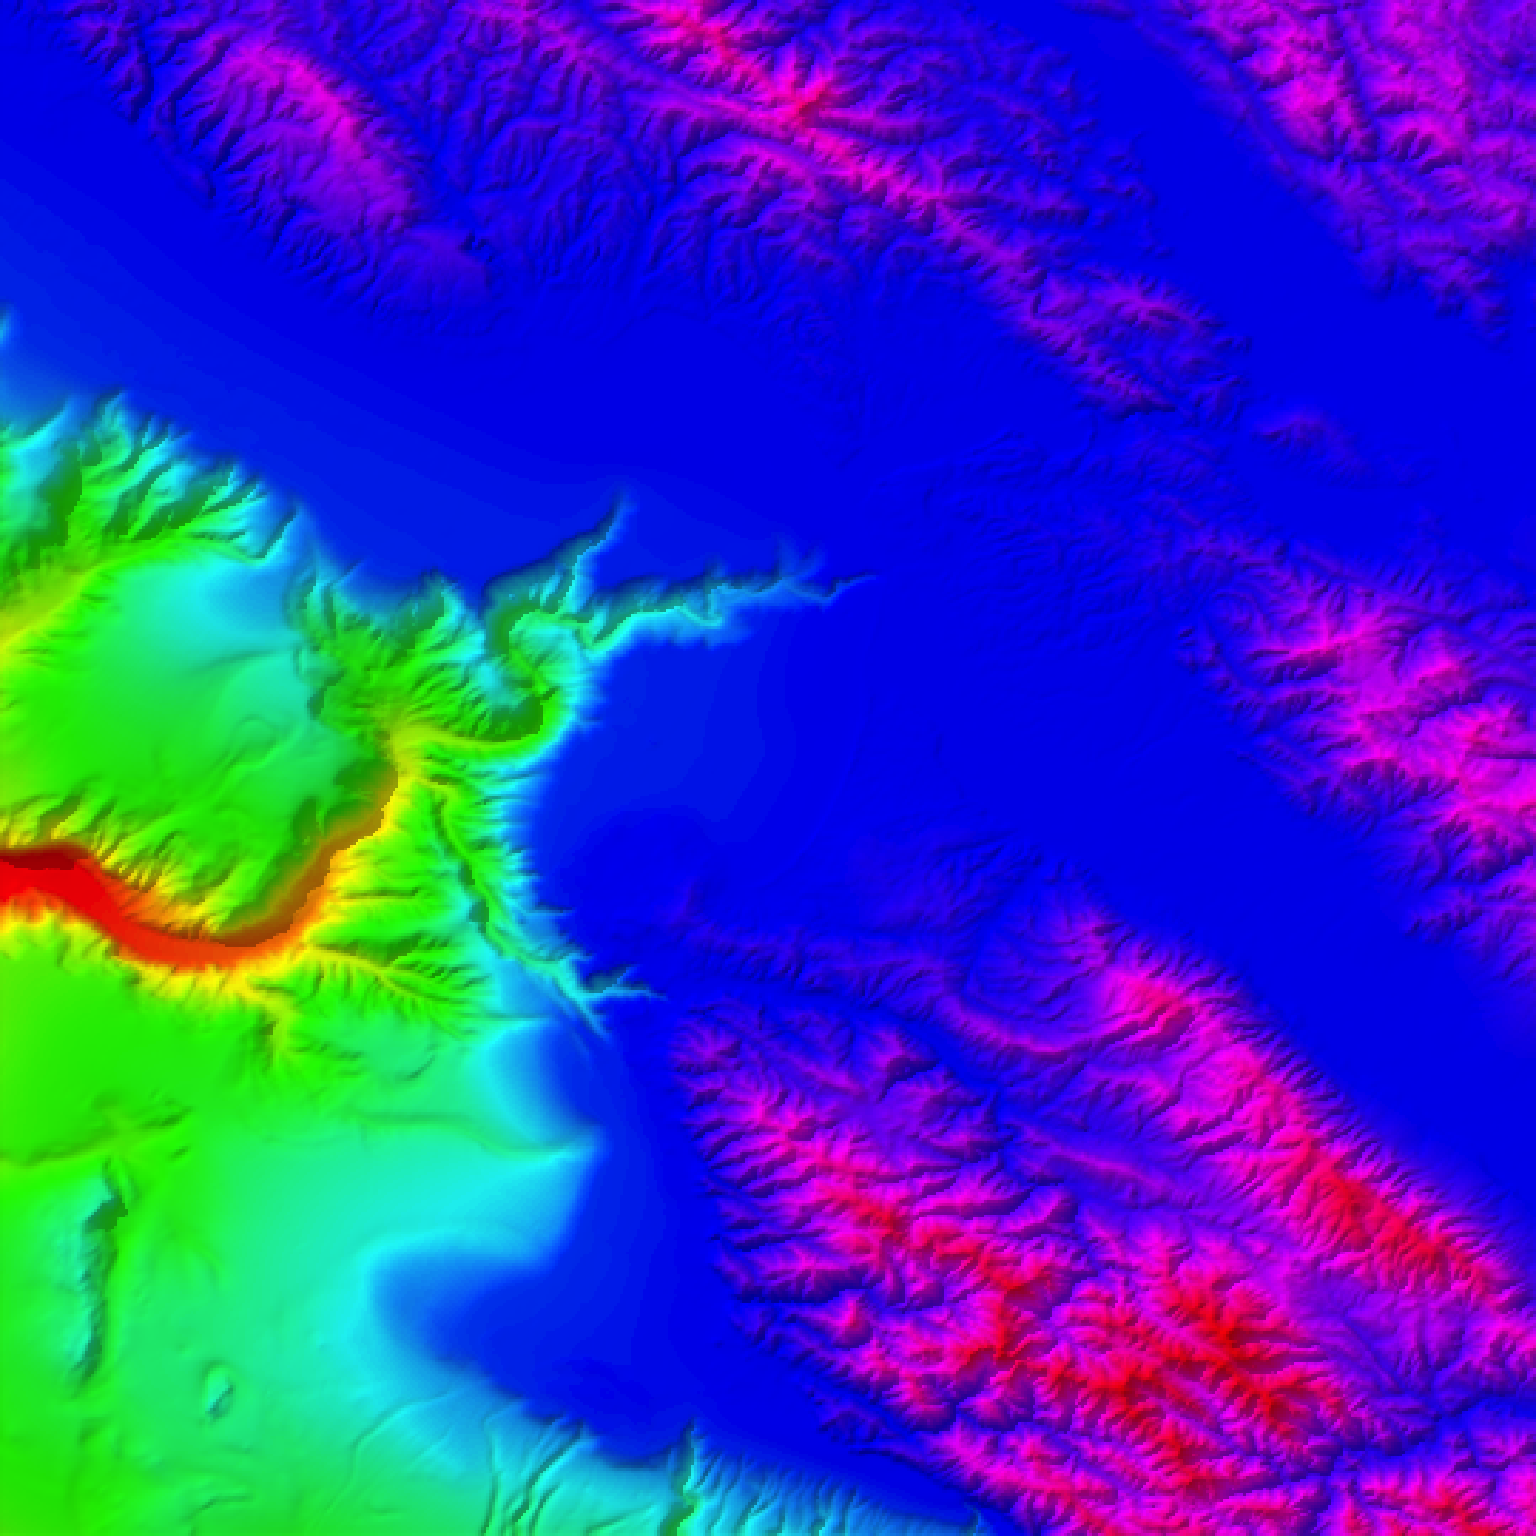
 #Really change the palette (warning: gratuitous use of rainbow palette):
if(run_documentation()) {
montereybay |>
height_shade(texture = rainbow(256)) |>
add_shadow(ray_shade(montereybay,zscale=50),0.1) |>
plot_map()
}
#Really change the palette (warning: gratuitous use of rainbow palette):
if(run_documentation()) {
montereybay |>
height_shade(texture = rainbow(256)) |>
add_shadow(ray_shade(montereybay,zscale=50),0.1) |>
plot_map()
}