This function creates an overlay with a scale bar of a user-specified length.
It uses the coordinates of the map (specified by passing an extent)
and then creates a scale bar at a specified x/y proportion across the map. If the map is not projected
(i.e. is in lat/long coordinates) this function will use the geosphere package to create a
scale bar of the proper length.
generate_scalebar_overlay(
  extent,
  length,
  x = 0.05,
  y = 0.05,
  latlong = FALSE,
  thickness = NA,
  bearing = 90,
  unit = "m",
  flip_ticks = FALSE,
  labels = NA,
  text_size = 1,
  decimals = 0,
  text_offset = 1,
  adj = 0.5,
  heightmap = NULL,
  width = NA,
  height = NA,
  resolution_multiply = 1,
  color1 = "white",
  color2 = "black",
  text_color = "black",
  font = 1,
  border_color = "black",
  tick_color = "black",
  border_width = 1,
  tick_width = 1,
  halo_color = NA,
  halo_expand = 1,
  halo_alpha = 1,
  halo_offset = c(0, 0),
  halo_blur = 0,
  halo_edge_softness = 0.1
)
Arguments
- extent
Either an object representing the spatial extent of the scene (either from the
raster,terra,sf, orsppackages), a length-4 numeric vector specifyingc("xmin", "xmax","ymin","ymax"), or the spatial object (from the previously aforementioned packages) which will be automatically converted to an extent object. If this is in lat/long coordinates, be sure to setlatlong = TRUE.- length
The length of the scale bar, in
units. This should match the units used on the map, unlessextentuses lat/long coordinates. In that case, the distance should be in meters.- x
Default
0.05. The x-coordinate of the bottom-left corner of the scale bar, as a proportion of the full map width.- y
Default
0.05. The y-coordinate of the bottom-left corner of the scale bar, as a proportion of the full map height.- latlong
Default
FALSE. Set toTRUEif the map is in lat/long coordinates to get an accurate scale bar (using distance calculated with thegeospherepackage).- thickness
Default
NA, automatically computed as 1/20th the length of the scale bar. Width of the scale bar.- bearing
Default
90, horizontal. Direction (measured from north) of the scale bar.- unit
Default
m. Displayed unit on the scale bar.- flip_ticks
Default
FALSE. Whether to flip the ticks to the other side of the scale bar.- labels
Default
NA. Manually specify the three labels with a length-3 character vector. Use this if you want display units other than meters.- text_size
Default
1. Text size.- decimals
Default
0. Number of decimal places for scale bar labels.- text_offset
Default
1. Amount of offset to apply to the text from the scale bar, as a multiple ofthickness.- adj
Default
0.5, centered. Text justification.0is left-justified, and1is right-justified.- heightmap
Default
NULL. The original height map. Pass this in to extract the dimensions of the resulting RGB image array automatically.- width
Default
NA. Width of the resulting image array. Default the same dimensions as height map.- height
Default
NA. Width of the resulting image array. Default the same dimensions as height map.- resolution_multiply
Default
1. If passing inheightmapinstead of width/height, amount to increase the resolution of the overlay, which should make lines/polygons/text finer. Should be combined withadd_overlay()withrescale_original = TRUEto ensure those added details are captured in the final map.- color1
Default
black. Primary color of the scale bar.- color2
Default
white. Secondary color of the scale bar.- text_color
Default
black. Text color.- font
Default
1. An integer which specifies which font to use for text. If possible, device drivers arrange so that 1 corresponds to plain text (the default), 2 to bold face, 3 to italic and 4 to bold italic.- border_color
Default
black. Border color of the scale bar.- tick_color
Default
black. Tick color of the scale bar.- border_width
Default
1. Width of the scale bar border.- tick_width
Default
1. Width of the tick.- halo_color
Default
NA, no halo. If a color is specified, the text label will be surrounded by a halo of this color.- halo_expand
Default
1. Number of pixels to expand the halo.- halo_alpha
Default
1. Transparency of the halo.- halo_offset
Default
c(0,0). Horizontal and vertical offset to apply to the halo, as a proportion of the full scene.- halo_blur
Default
0. Amount of blur to apply to the halo. Values greater than30won't result in further blurring.- halo_edge_softness
Default
0.1. Width of the softened halo edge transition, in pixels.
Value
Semi-transparent overlay with a scale bar.
Examples
if(run_documentation()) {
#Create the water palette
water_palette = colorRampPalette(c("darkblue", "dodgerblue", "lightblue"))(200)
bathy_hs = height_shade(montereybay, texture = water_palette)
#Set scalebar font
par(family = "Arial")
#Generate flat water heightmap
mbay = montereybay
mbay[mbay < 0] = 0
base_map = mbay |>
height_shade() |>
add_overlay(generate_altitude_overlay(bathy_hs, montereybay, 0, 0)) |>
add_shadow(lamb_shade(montereybay,zscale=50),0.3)
#For convenience, the extent of the montereybay dataset is included as an attribute
mb_extent = attr(montereybay, "extent")
#Add a scalebar
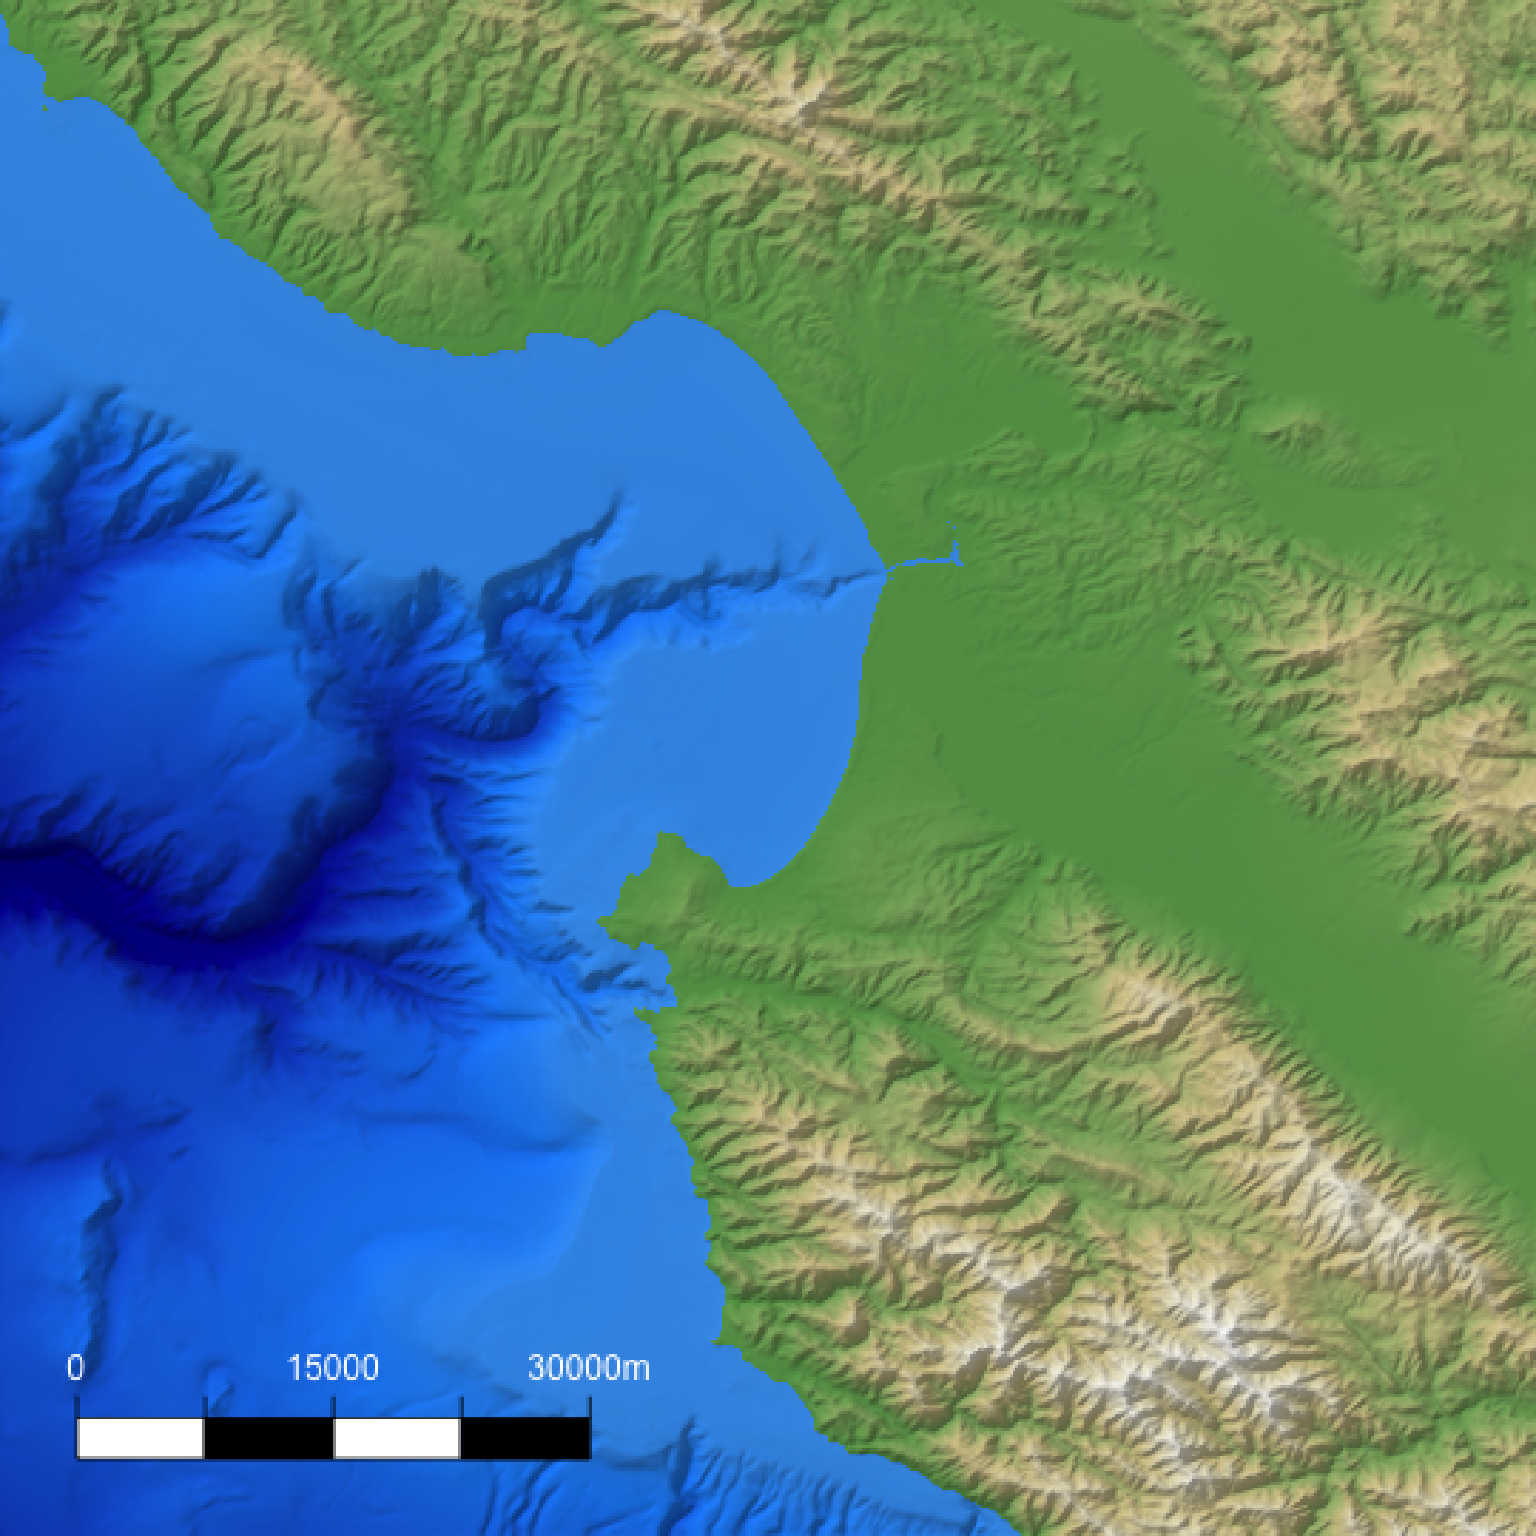
base_map |>
add_overlay(generate_scalebar_overlay(extent = mb_extent, length = 40000,
heightmap = montereybay,
latlong=TRUE)) |>
plot_map()
}
 if(run_documentation()) {
#Change the text color
base_map |>
add_overlay(generate_scalebar_overlay(extent = mb_extent, length = 40000,
text_color = "white",
heightmap = montereybay,
latlong=TRUE)) |>
plot_map()
}
if(run_documentation()) {
#Change the text color
base_map |>
add_overlay(generate_scalebar_overlay(extent = mb_extent, length = 40000,
text_color = "white",
heightmap = montereybay,
latlong=TRUE)) |>
plot_map()
}
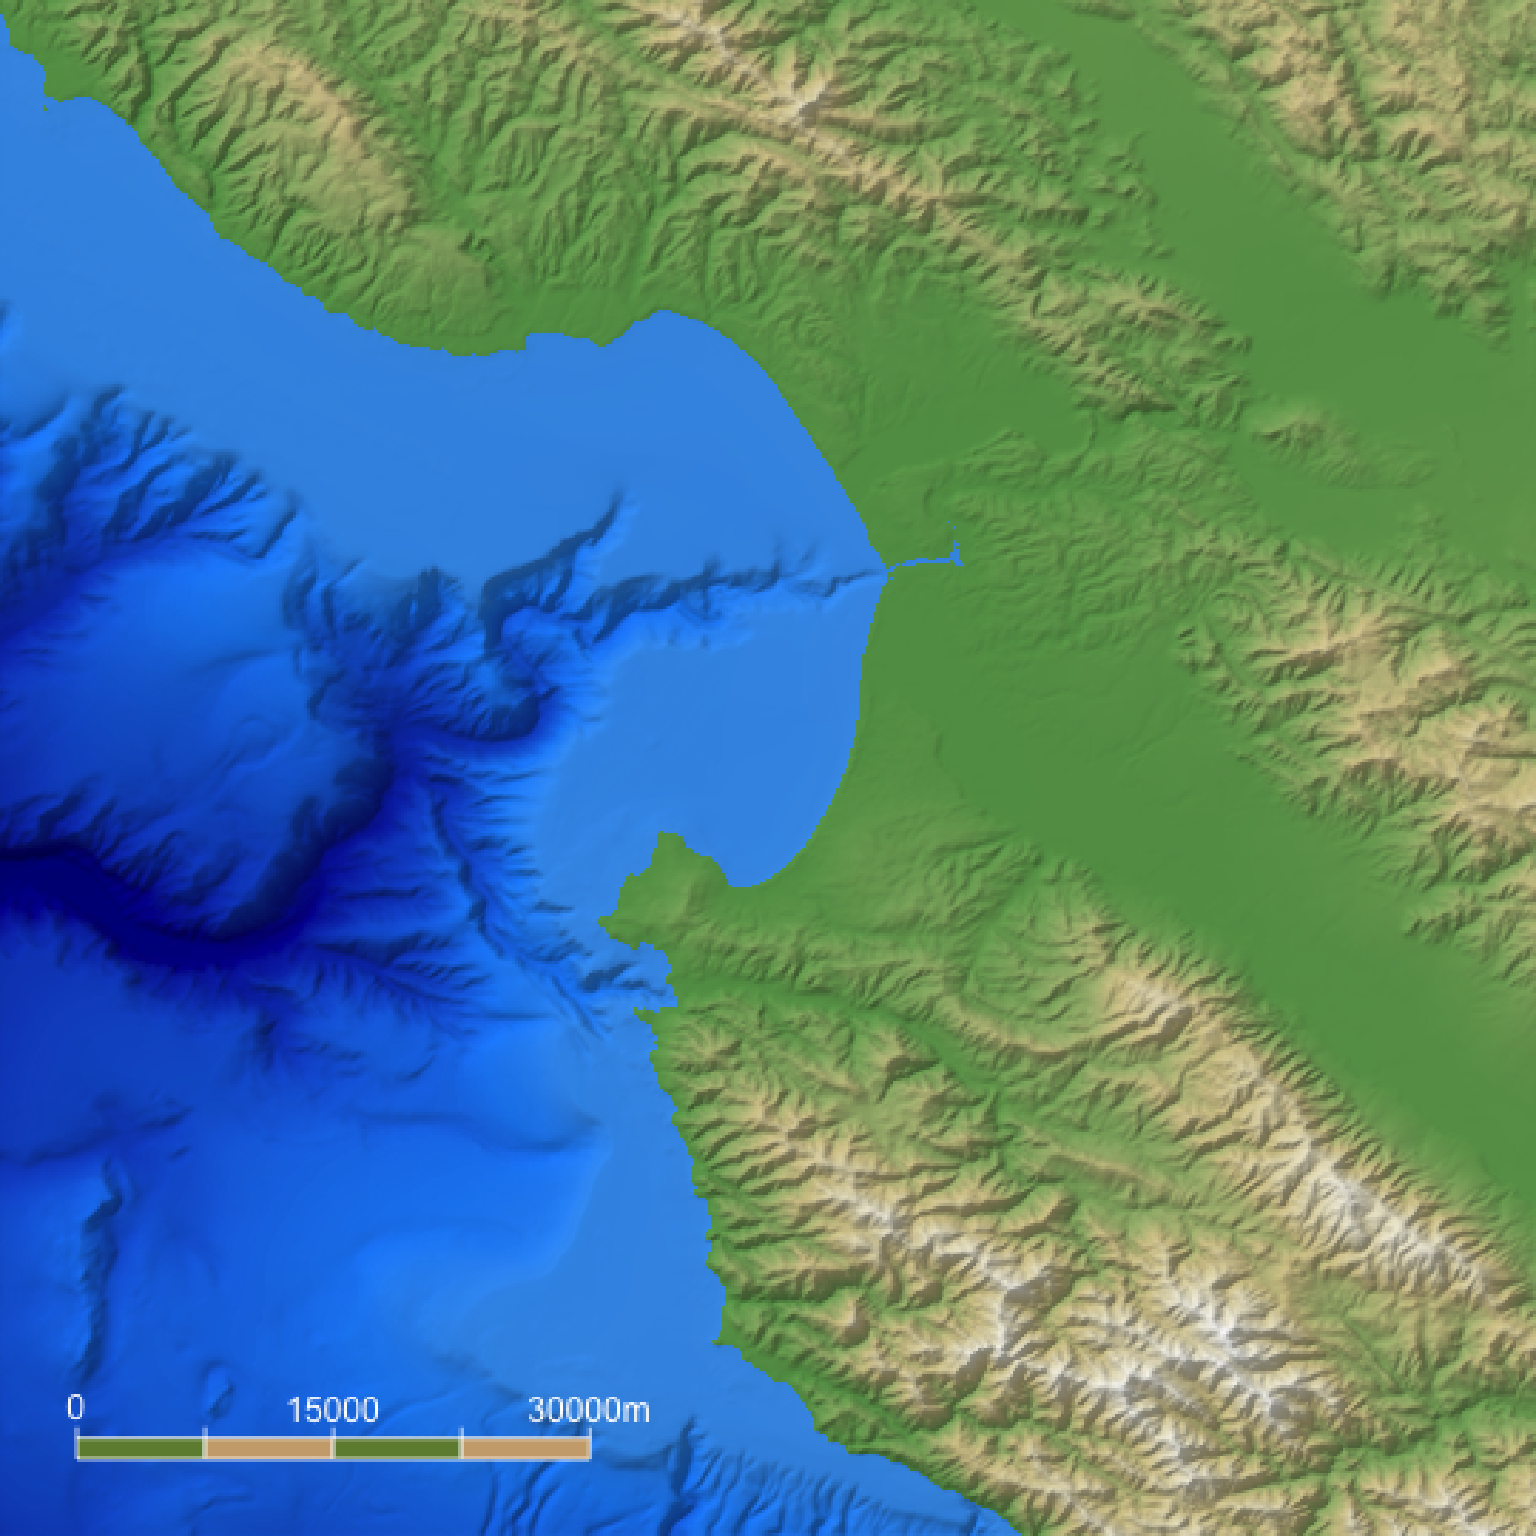
 if(run_documentation()) {
#Change the length
base_map |>
add_overlay(generate_scalebar_overlay(extent = mb_extent, length = 30000,
text_color = "white",
heightmap = montereybay,
latlong=TRUE)) |>
plot_map()
}
if(run_documentation()) {
#Change the length
base_map |>
add_overlay(generate_scalebar_overlay(extent = mb_extent, length = 30000,
text_color = "white",
heightmap = montereybay,
latlong=TRUE)) |>
plot_map()
}
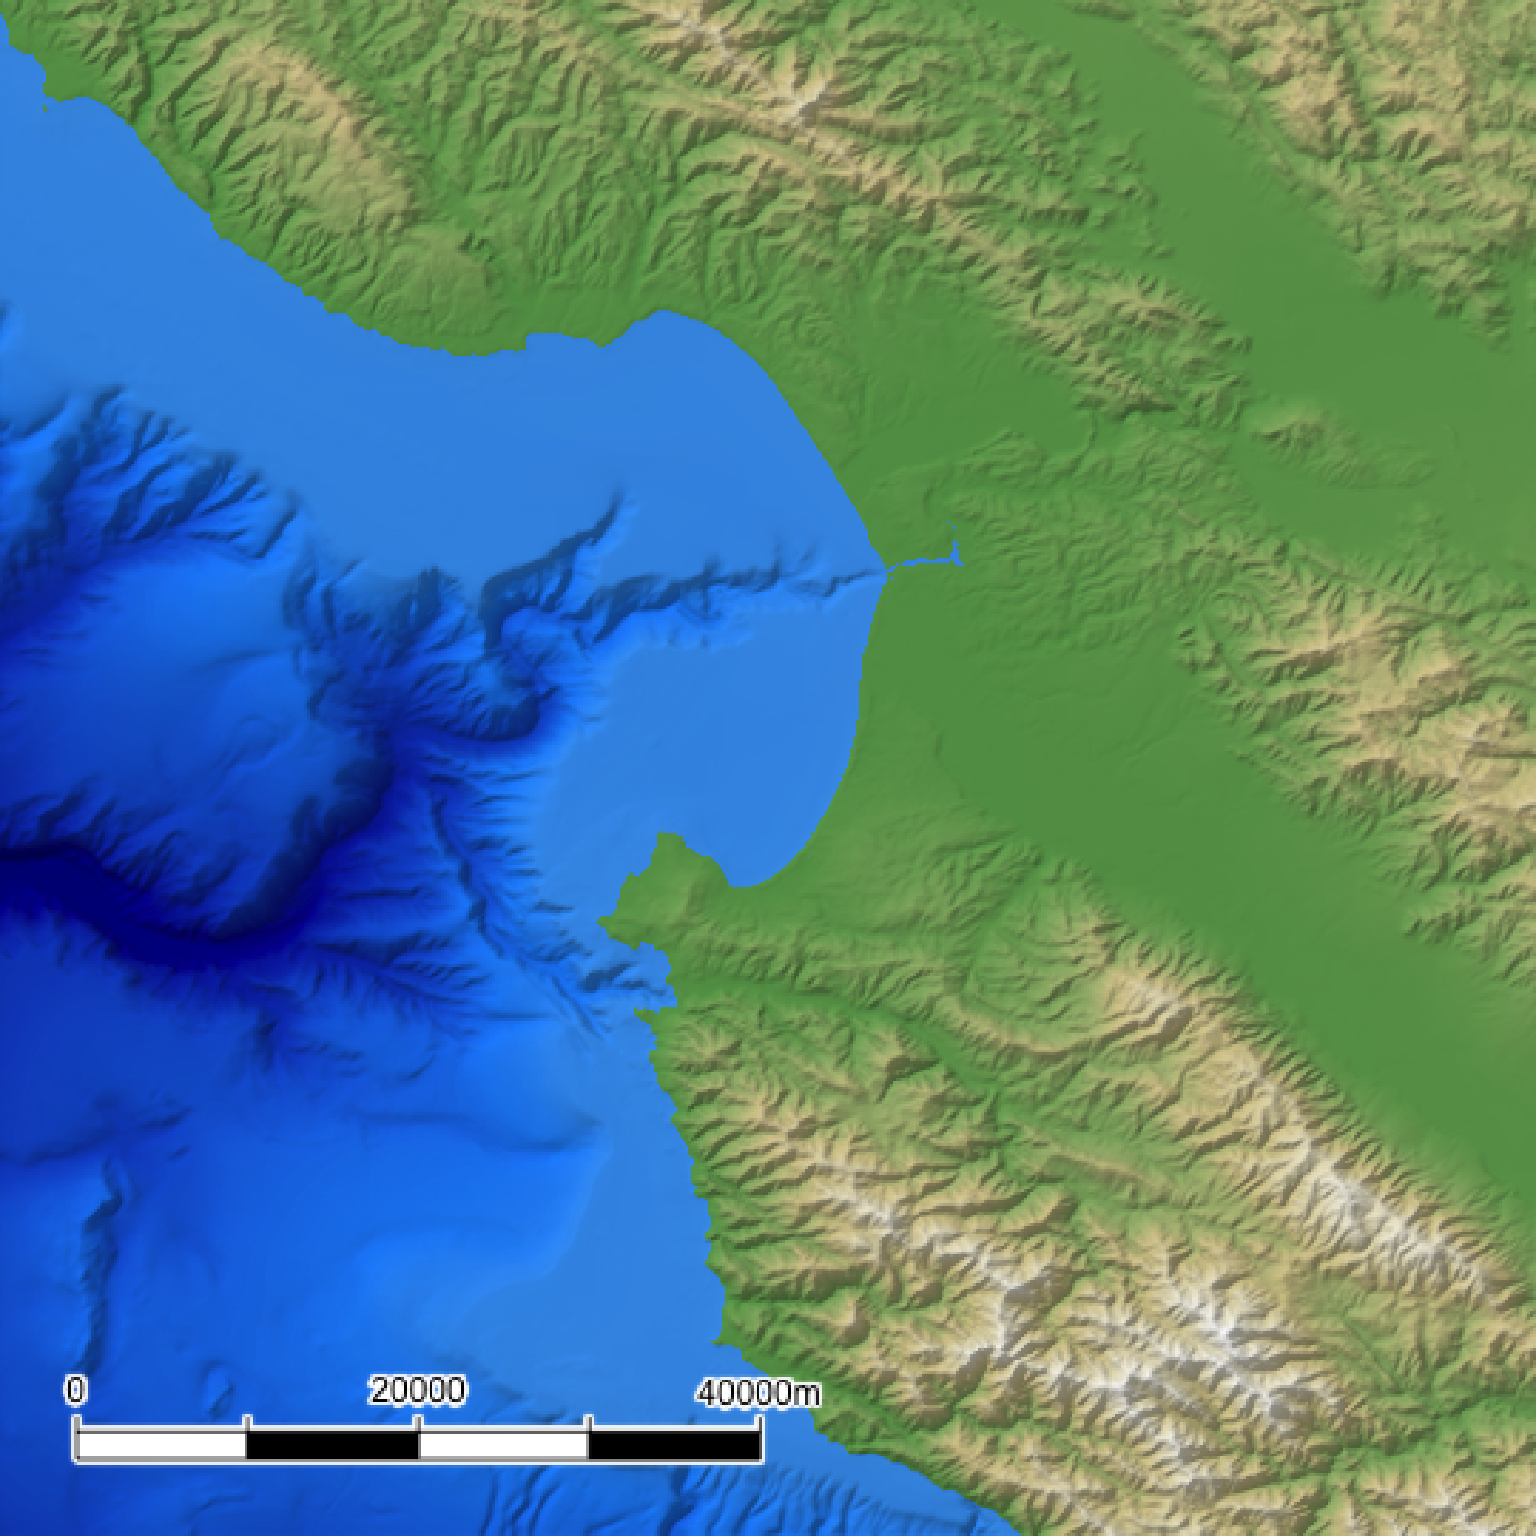
 if(run_documentation()) {
#Change the thickness (default is length/20)
base_map |>
add_overlay(generate_scalebar_overlay(extent = mb_extent, length = 30000,
text_color = "white", thickness = 30000/10,
heightmap = montereybay,
latlong=TRUE)) |>
plot_map()
}
if(run_documentation()) {
#Change the thickness (default is length/20)
base_map |>
add_overlay(generate_scalebar_overlay(extent = mb_extent, length = 30000,
text_color = "white", thickness = 30000/10,
heightmap = montereybay,
latlong=TRUE)) |>
plot_map()
}
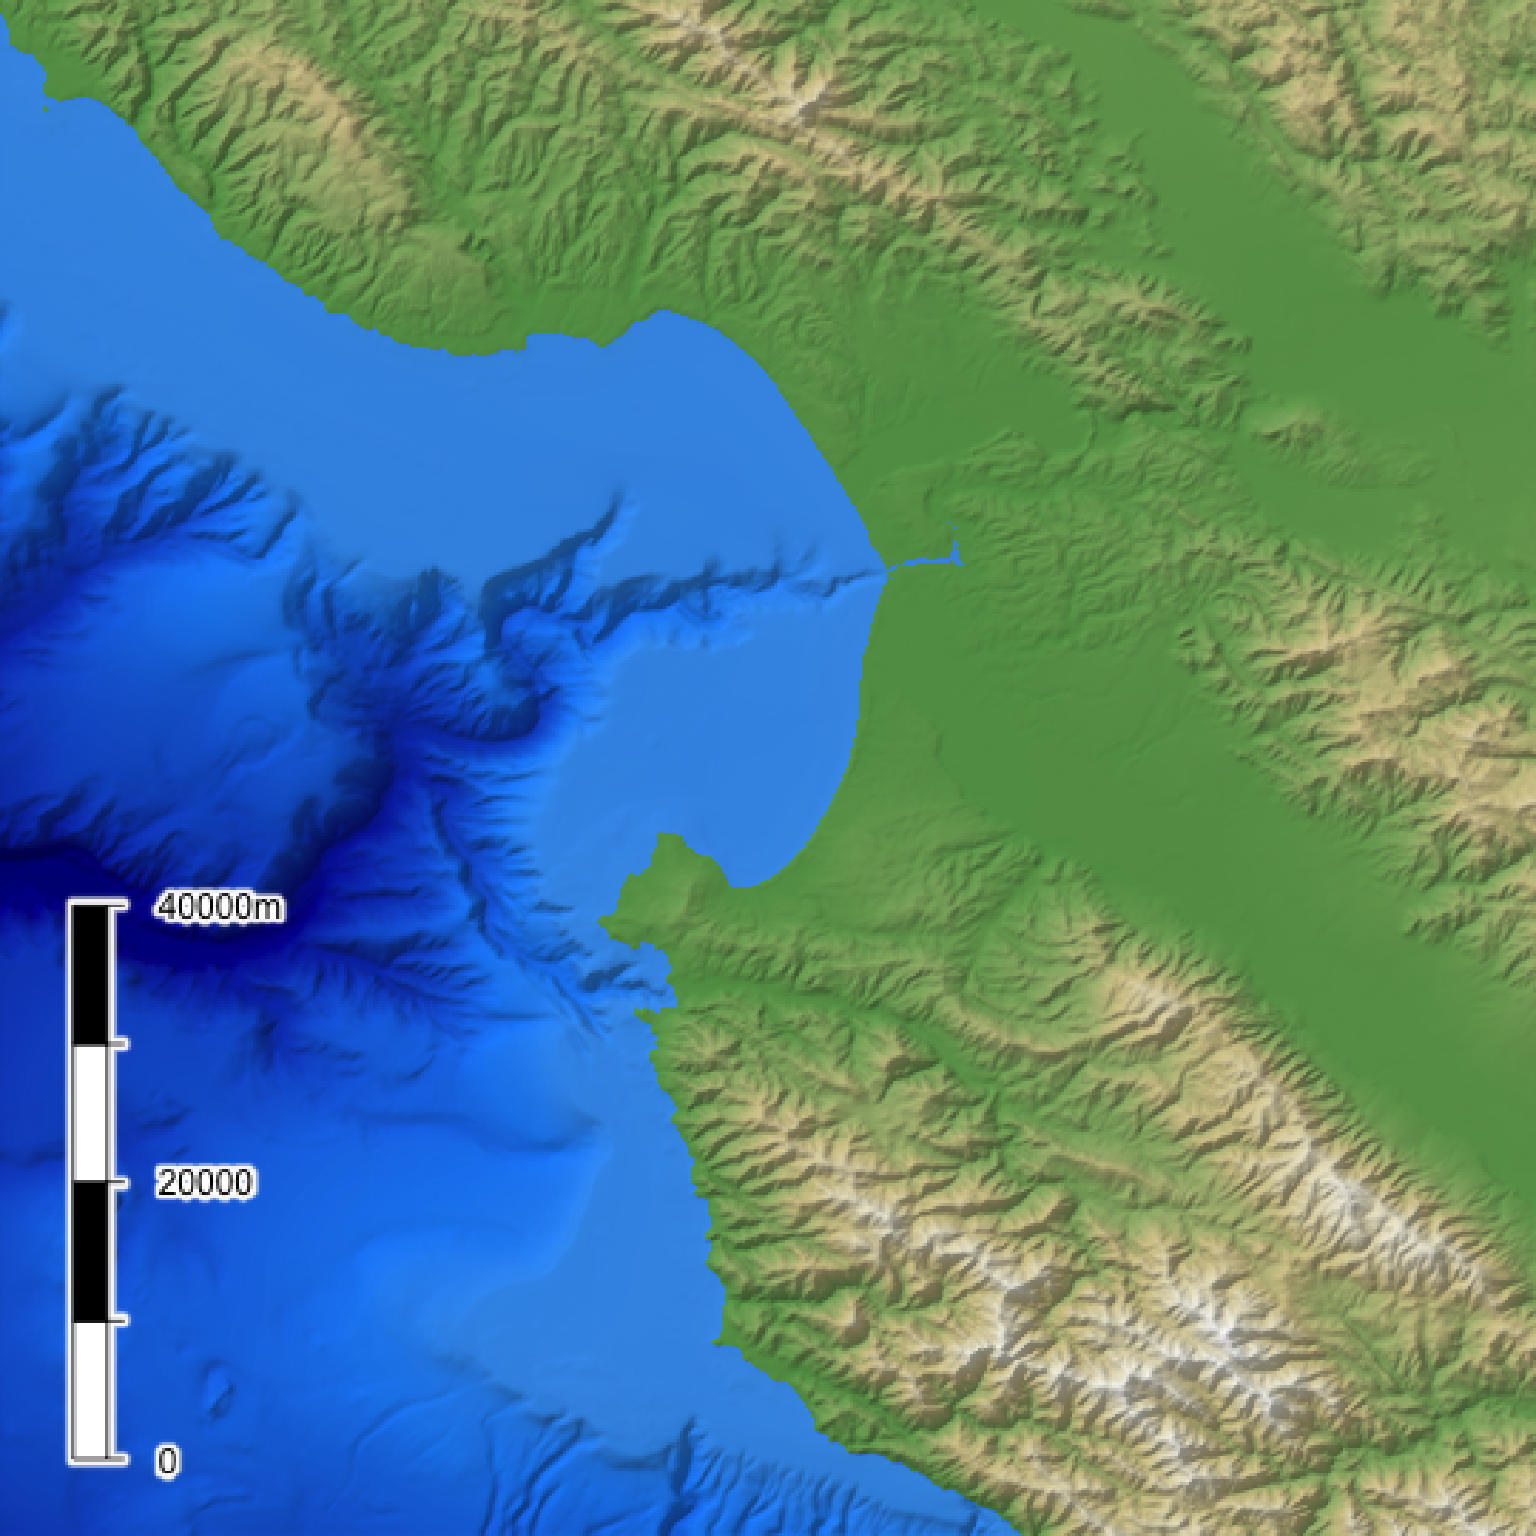
 if(run_documentation()) {
#Change the text offset (given in multiples of thickness)
base_map |>
add_overlay(generate_scalebar_overlay(extent = mb_extent, length = 30000,
text_color = "white", thickness = 30000/10,
text_offset = 0.75,
heightmap = montereybay,
latlong=TRUE)) |>
plot_map()
}
if(run_documentation()) {
#Change the text offset (given in multiples of thickness)
base_map |>
add_overlay(generate_scalebar_overlay(extent = mb_extent, length = 30000,
text_color = "white", thickness = 30000/10,
text_offset = 0.75,
heightmap = montereybay,
latlong=TRUE)) |>
plot_map()
}
 if(run_documentation()) {
#Change the primary and secondary colors, along with the border and tick color
base_map |>
add_overlay(generate_scalebar_overlay(extent = mb_extent, length = 30000,
text_color = "white", border_color = "white",
tick_color = "white",
color1 = "darkolivegreen4", color2 = "burlywood3",
heightmap = montereybay,
latlong=TRUE)) |>
plot_map()
}
if(run_documentation()) {
#Change the primary and secondary colors, along with the border and tick color
base_map |>
add_overlay(generate_scalebar_overlay(extent = mb_extent, length = 30000,
text_color = "white", border_color = "white",
tick_color = "white",
color1 = "darkolivegreen4", color2 = "burlywood3",
heightmap = montereybay,
latlong=TRUE)) |>
plot_map()
}
 if(run_documentation()) {
#Add a halo
base_map |>
add_overlay(generate_scalebar_overlay(extent = mb_extent, length = 40000,
halo_color = "white", halo_expand = 1,
heightmap = montereybay, font = 2,
latlong=TRUE)) |>
plot_map()
}
if(run_documentation()) {
#Add a halo
base_map |>
add_overlay(generate_scalebar_overlay(extent = mb_extent, length = 40000,
halo_color = "white", halo_expand = 1,
heightmap = montereybay, font = 2,
latlong=TRUE)) |>
plot_map()
}
 if(run_documentation()) {
#Change the orientation, position, text alignment, and flip the ticks to the other side
base_map |>
add_overlay(generate_scalebar_overlay(extent = mb_extent, length = 40000, x = 0.07,
bearing=0, adj = 0, flip_ticks = TRUE,
halo_color = "white", halo_expand = 1.5,
heightmap = montereybay, font = 2,
latlong=TRUE)) |>
plot_map()
}
if(run_documentation()) {
#Change the orientation, position, text alignment, and flip the ticks to the other side
base_map |>
add_overlay(generate_scalebar_overlay(extent = mb_extent, length = 40000, x = 0.07,
bearing=0, adj = 0, flip_ticks = TRUE,
halo_color = "white", halo_expand = 1.5,
heightmap = montereybay, font = 2,
latlong=TRUE)) |>
plot_map()
}
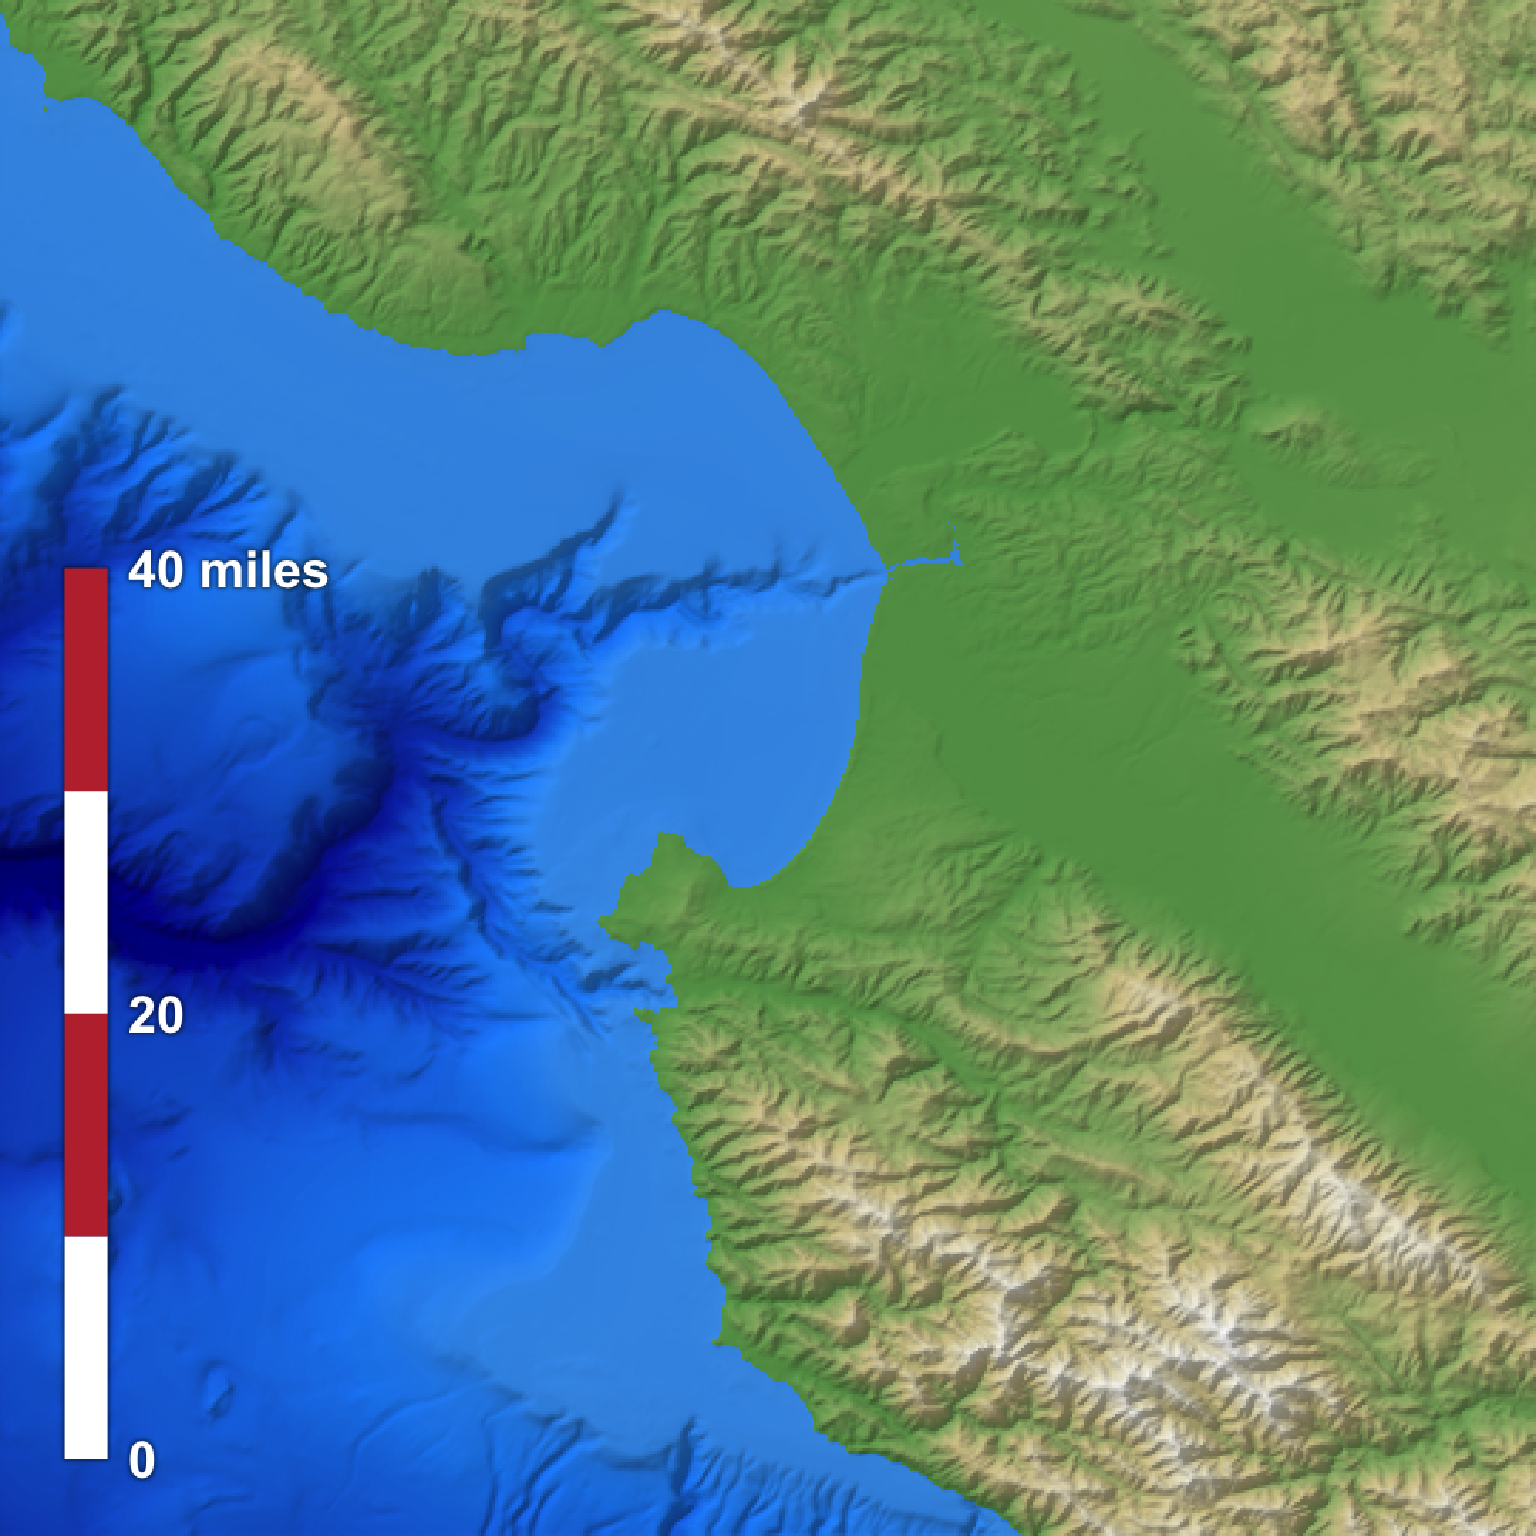
 if(run_documentation()) {
#64373.8 meters in 40 miles
#Create custom labels, change font and text size, remove the border/ticks, and change the color
#Here, we specify a width and height to double the resolution of the image (for sharper text)
base_map |>
add_overlay(generate_scalebar_overlay(extent = mb_extent, length = 64373.8, x = 0.07,
labels = c("0", "20", "40 miles"), thickness=2500,
text_size=3, font = 2, text_offset = 0,
text_color="white", color2="#bf323b", border_color=NA,
tick_color="red", tick_width=0,
bearing=0, adj = 0, flip_ticks = TRUE,
halo_color="black", halo_blur=3, halo_alpha=0.5,
width = ncol(montereybay)*2,
height = nrow(montereybay)*2,
latlong=TRUE), rescale_original=TRUE) |>
plot_map()
}
if(run_documentation()) {
#64373.8 meters in 40 miles
#Create custom labels, change font and text size, remove the border/ticks, and change the color
#Here, we specify a width and height to double the resolution of the image (for sharper text)
base_map |>
add_overlay(generate_scalebar_overlay(extent = mb_extent, length = 64373.8, x = 0.07,
labels = c("0", "20", "40 miles"), thickness=2500,
text_size=3, font = 2, text_offset = 0,
text_color="white", color2="#bf323b", border_color=NA,
tick_color="red", tick_width=0,
bearing=0, adj = 0, flip_ticks = TRUE,
halo_color="black", halo_blur=3, halo_alpha=0.5,
width = ncol(montereybay)*2,
height = nrow(montereybay)*2,
latlong=TRUE), rescale_original=TRUE) |>
plot_map()
}