Render a 2D floating overlay over the map.
Note: Multiple layers with transparency can cause rendering issues in rgl.
render_floating_overlay(
  overlay = NULL,
  altitude = NULL,
  heightmap = NULL,
  zscale = 1,
  alpha = 1,
  baseshape = "rectangle",
  remove_na = TRUE,
  reorient = TRUE,
  clear_layers = FALSE,
  horizontal_offset = c(0, 0),
  ...
)
Arguments
- overlay
Overlay (4D RGBA array) to be rendered on the 3D map.
- altitude
Altitude to place the overlay.
- heightmap
The underlying surface. A two-dimensional matrix, where each entry in the matrix is the elevation at that point.
- zscale
Default
1. The ratio between the x and y spacing (which are assumed to be equal) and the z axis. For example, if the elevation levels are in units of 1 meter and the grid values are separated by 10 meters,zscalewould be 10. Adjust the zscale down to exaggerate elevation features.- alpha
Default
1. Multiplies the layer's transparency by this factor. 0 is completely transparent.- baseshape
Default
rectangle. Shape of the overlay. Options arec("rectangle", "circle", "hex").- remove_na
Default
TRUE. Whether to make the overlay transparent above empty spaces (represented byNAvalues) in the underlying elevation matrix.- reorient
Default
TRUE. Whether to reorient the image array to match the 3D plot.- clear_layers
Default
FALSE. Clears all existing floating layers on the visualization.- horizontal_offset
Default
c(0,0). Distance (in 3D space) to offset the floating offset in the x/y directions.- ...
Additional arguments to pass to
rgl::triangles3d().
Value
Adds a 3D floating layer to the map. No return value.
Examples
if(run_documentation()) {
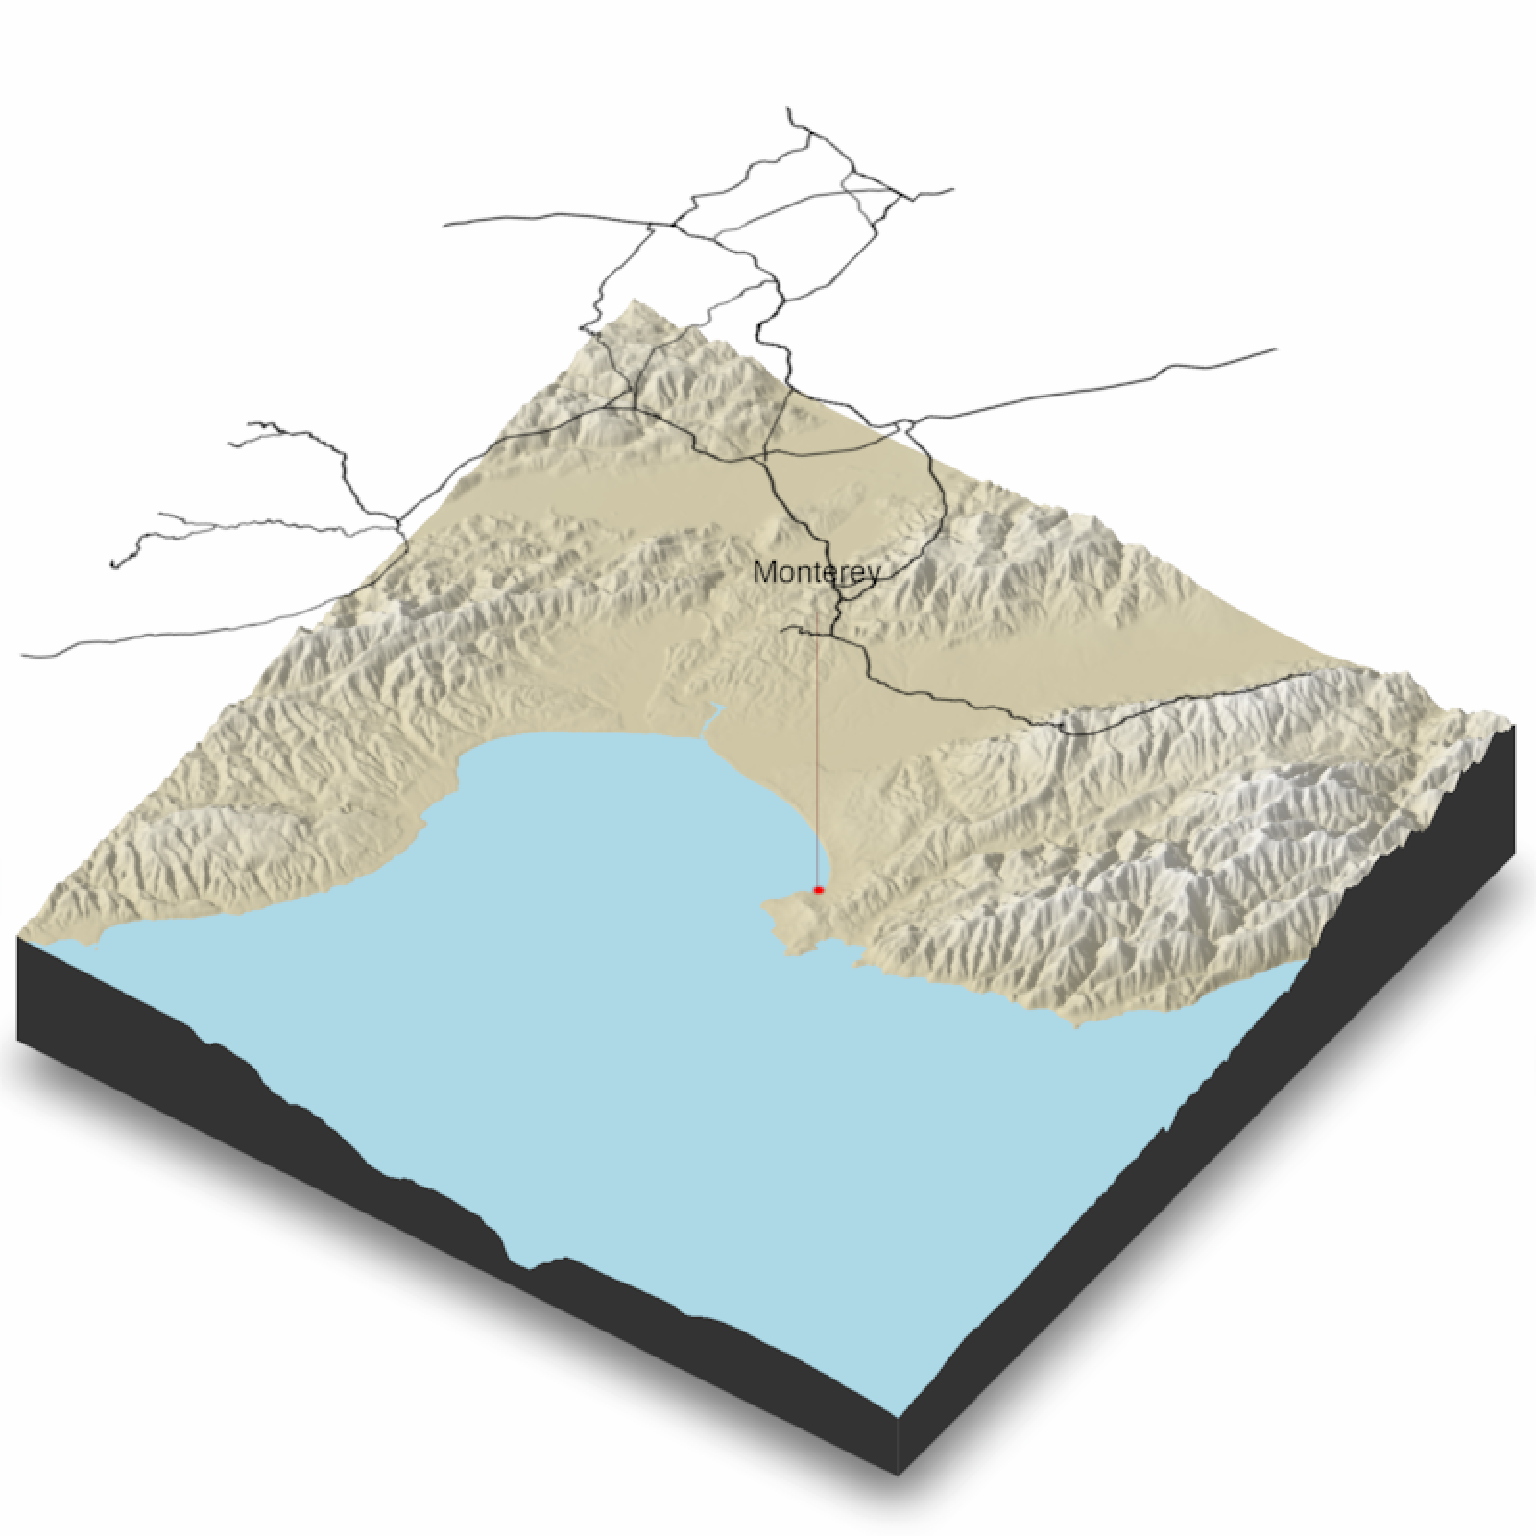
#Render the road network as a floating overlay layer, along with a label annotation and a floating
#point annotation
if(all(length(find.package("sf", quiet = TRUE)) > 0,
length(find.package("magick", quiet = TRUE)) > 0)) {
monterey = c(-121.892933,36.603053)
monterey_city = sf::st_sfc(sf::st_point(monterey))
#Generate Overlays
road_overlay = generate_line_overlay(monterey_roads_sf, attr(montereybay,"extent"),
heightmap = montereybay)
point_overlay = generate_point_overlay(monterey_city, color="red", size=1,
attr(montereybay,"extent"), heightmap = montereybay)
#Create 3D plot (water transparency set to 1 because multiple transparency layers can interfere)
montereybay |>
height_shade() |>
add_shadow(ray_shade(montereybay,zscale=50),0.3) |>
plot_3d(montereybay, water = T, wateralpha = 1, windowsize = 800, watercolor = "lightblue")
render_camera(theta=-55,phi=45,zoom=0.8)
#Render label
render_label(montereybay, lat = monterey[2], long = monterey[1], altitude = 9900,
extent = attr(montereybay, "extent"),
zscale = 50, text = "Monterey", textcolor = "black", linecolor="darkred")
#Render Floating Overlays
render_floating_overlay(road_overlay, altitude = 10000,zscale = 50)
render_floating_overlay(point_overlay, altitude = 100,zscale = 50)
render_snapshot()
}
}
#> `montereybay` dataset used with no zscale--setting `zscale=50`. For a realistic depiction, raise `zscale` to 200.