Calculates and returns an overlay of points for the current map.
generate_point_overlay(
  geometry,
  extent,
  heightmap = NULL,
  width = NA,
  height = NA,
  resolution_multiply = 1,
  pch = 16,
  color = "black",
  size = 1,
  offset = c(0, 0),
  data_column_width = NULL
)
Arguments
- geometry
An
sfobject with POINT geometry.- extent
Either an object representing the spatial extent of the scene (either from the
raster,terra,sf, orsppackages), a length-4 numeric vector specifyingc("xmin", "xmax","ymin","ymax"), or the spatial object (from the previously aforementioned packages) which will be automatically converted to an extent object.- heightmap
Default
NULL. The original height map. Pass this in to extract the dimensions of the resulting overlay automatically.- width
Default
NA. Width of the resulting overlay. Default the same dimensions as height map.- height
Default
NA. Width of the resulting overlay. Default the same dimensions as height map.- resolution_multiply
Default
1. If passing inheightmapinstead of width/height, amount to increase the resolution of the overlay, which should make lines/polygons/points finer. Should be combined withadd_overlay()withrescale_original = TRUEto ensure those added details are captured in the final map.- pch
Default
16, solid. Point symbol.0= square,1= circle,2= triangle point up,3= plus,4= cross,5= diamond,6= triangle point down,7= square cross,8= star,9= diamond plus,10= circle plus,11= triangles up and down,12= square plus,13= circle cross,14= square and triangle down,15= filled square,16= filled circle,17= filled triangle point-up,18= filled diamond,19= solid circle,20= bullet (smaller circle),21= filled circle blue,22= filled square blue,23= filled diamond blue,24= filled triangle point-up blue,25= filled triangle point down blue- color
Default
black. Color of the points.- size
Default
1. Point size.- offset
Default
c(0,0). Horizontal and vertical offset to apply to the polygon, in units ofgeometry.- data_column_width
Default
NULL. The numeric column to map the width to. The maximum width will be the value specified inlinewidth.
Value
Semi-transparent overlay with contours.
Examples
#Add the included `sf` object with roads to the montereybay dataset
if(run_documentation()) {
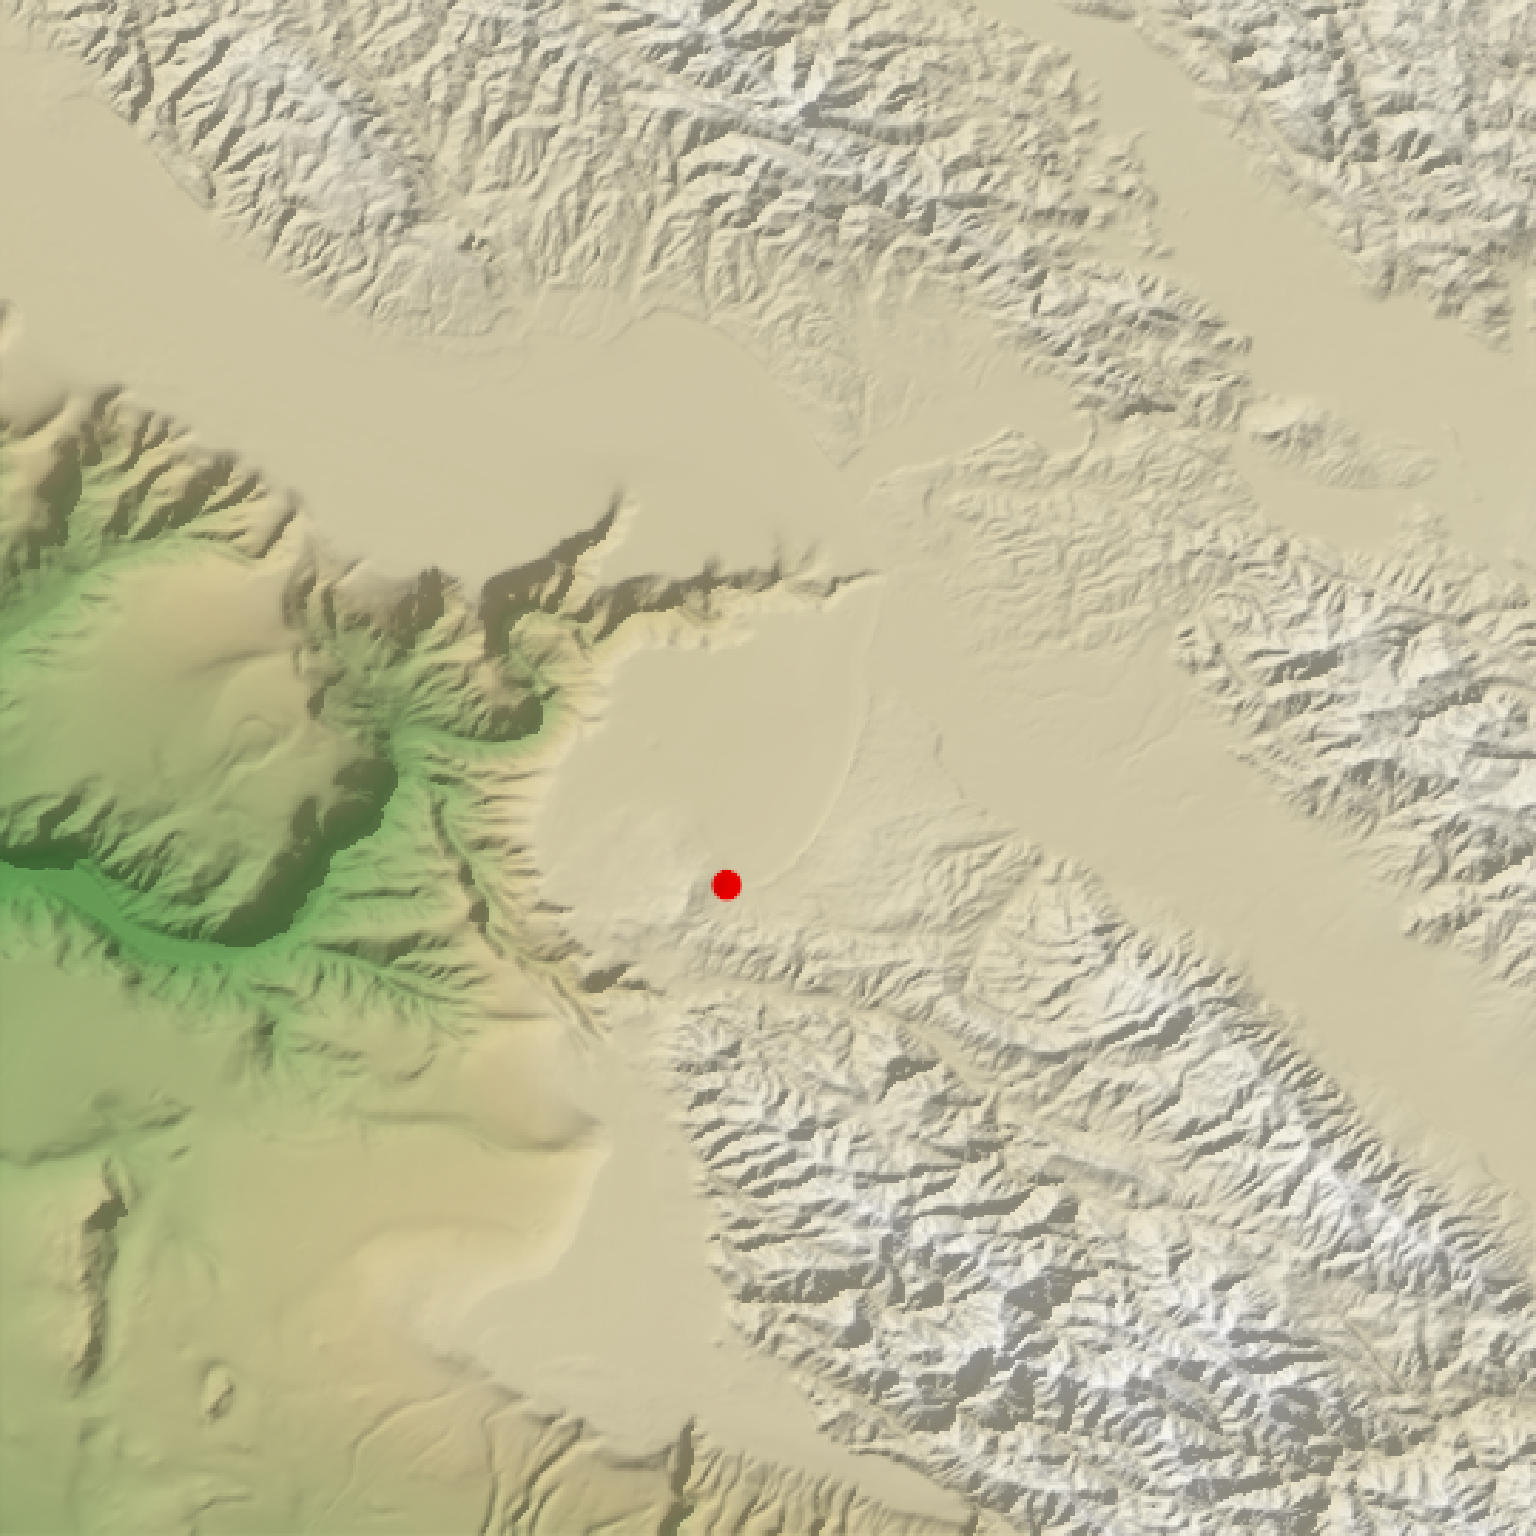
monterey_city = sf::st_sfc(sf::st_point(c(-121.893611, 36.603056)))
montereybay |>
height_shade() |>
add_overlay(generate_point_overlay(monterey_city, color="red", size=2,
attr(montereybay,"extent"), heightmap = montereybay)) |>
add_shadow(ray_shade(montereybay,zscale=50),0.3) |>
plot_map()
}