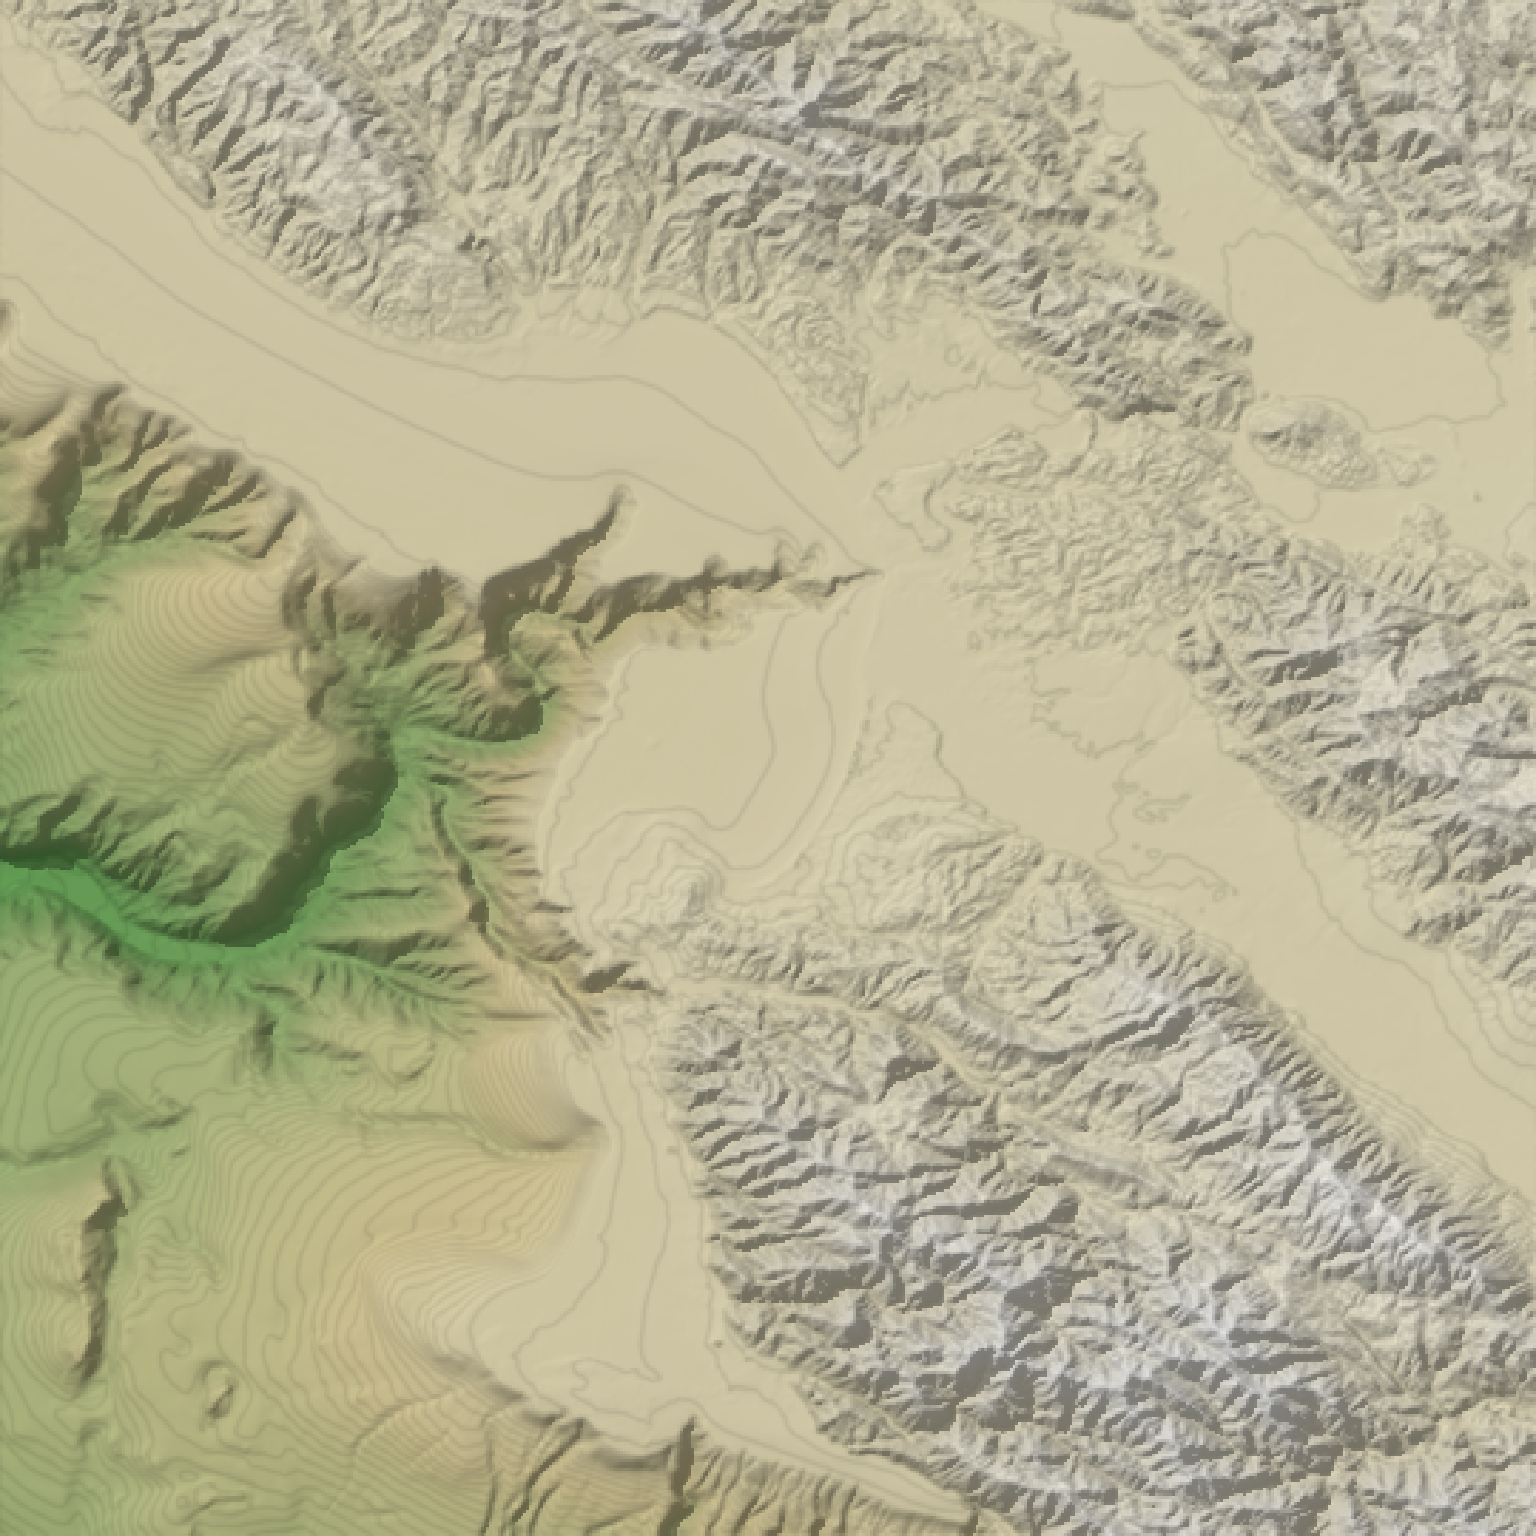
Calculates and returns an overlay of contour lines for the current height map.
generate_contour_overlay(
  heightmap,
  levels = NA,
  nlevels = NA,
  zscale = 1,
  width = NA,
  height = NA,
  resolution_multiply = 1,
  color = "black",
  linewidth = 1
)
Arguments
- heightmap
A two-dimensional matrix, where each entry in the matrix is the elevation at that point. All grid points are assumed to be evenly spaced.
- levels
Default
NA. Automatically generated with 10 levels. This argument specifies the exact height levels of each contour.- nlevels
Default
NA. Controls the auto-generation of levels. If levels is length-2, this will automatically generatenlevelsbreaks betweenlevels[1]andlevels[2].- zscale
Default
1. The ratio between the x and y spacing (which are assumed to be equal) and the z axis. For example, if the elevation levels are in units of 1 meter and the grid values are separated by 10 meters,zscalewould be 10.- width
Default
NA. Width of the resulting overlay. Default the same dimensions as heightmap.- height
Default
NA. Width of the resulting overlay. Default the same dimensions as heightmap.- resolution_multiply
Default
1. If passing inheightmapinstead of width/height, amount to increase the resolution of the overlay, which should make lines/polygons finer. Should be combined withadd_overlay()withrescale_original = TRUEto ensure those added details are captured in the final map.- color
Default
black. Color.- linewidth
Default
1. Line width.
Value
Semi-transparent overlay with contours.
Examples
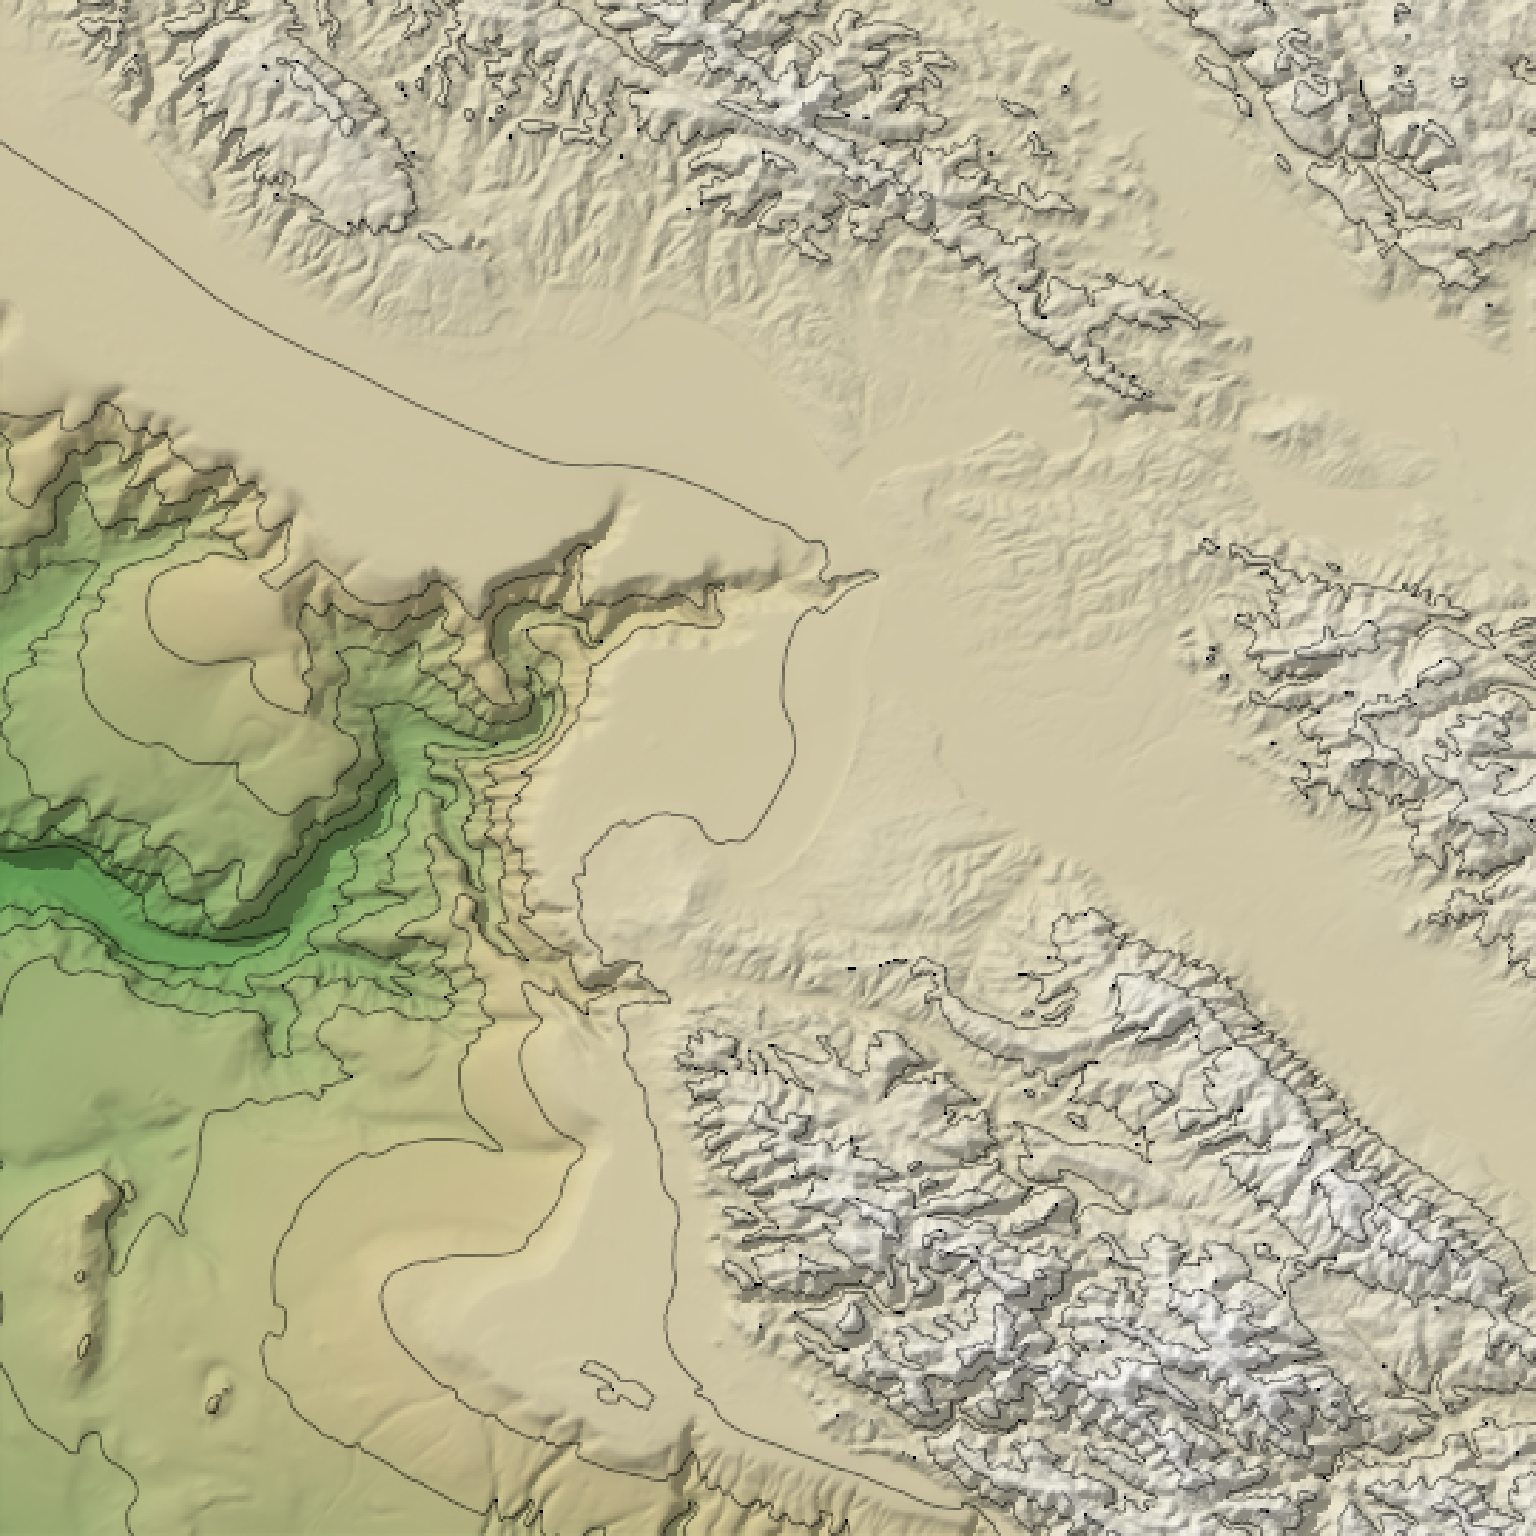
#Add contours to the montereybay dataset
if(run_documentation()) {
montereybay |>
height_shade() |>
add_overlay(generate_contour_overlay(montereybay)) |>
add_shadow(ray_shade(montereybay,zscale=50),0.3) |>
plot_map()
}
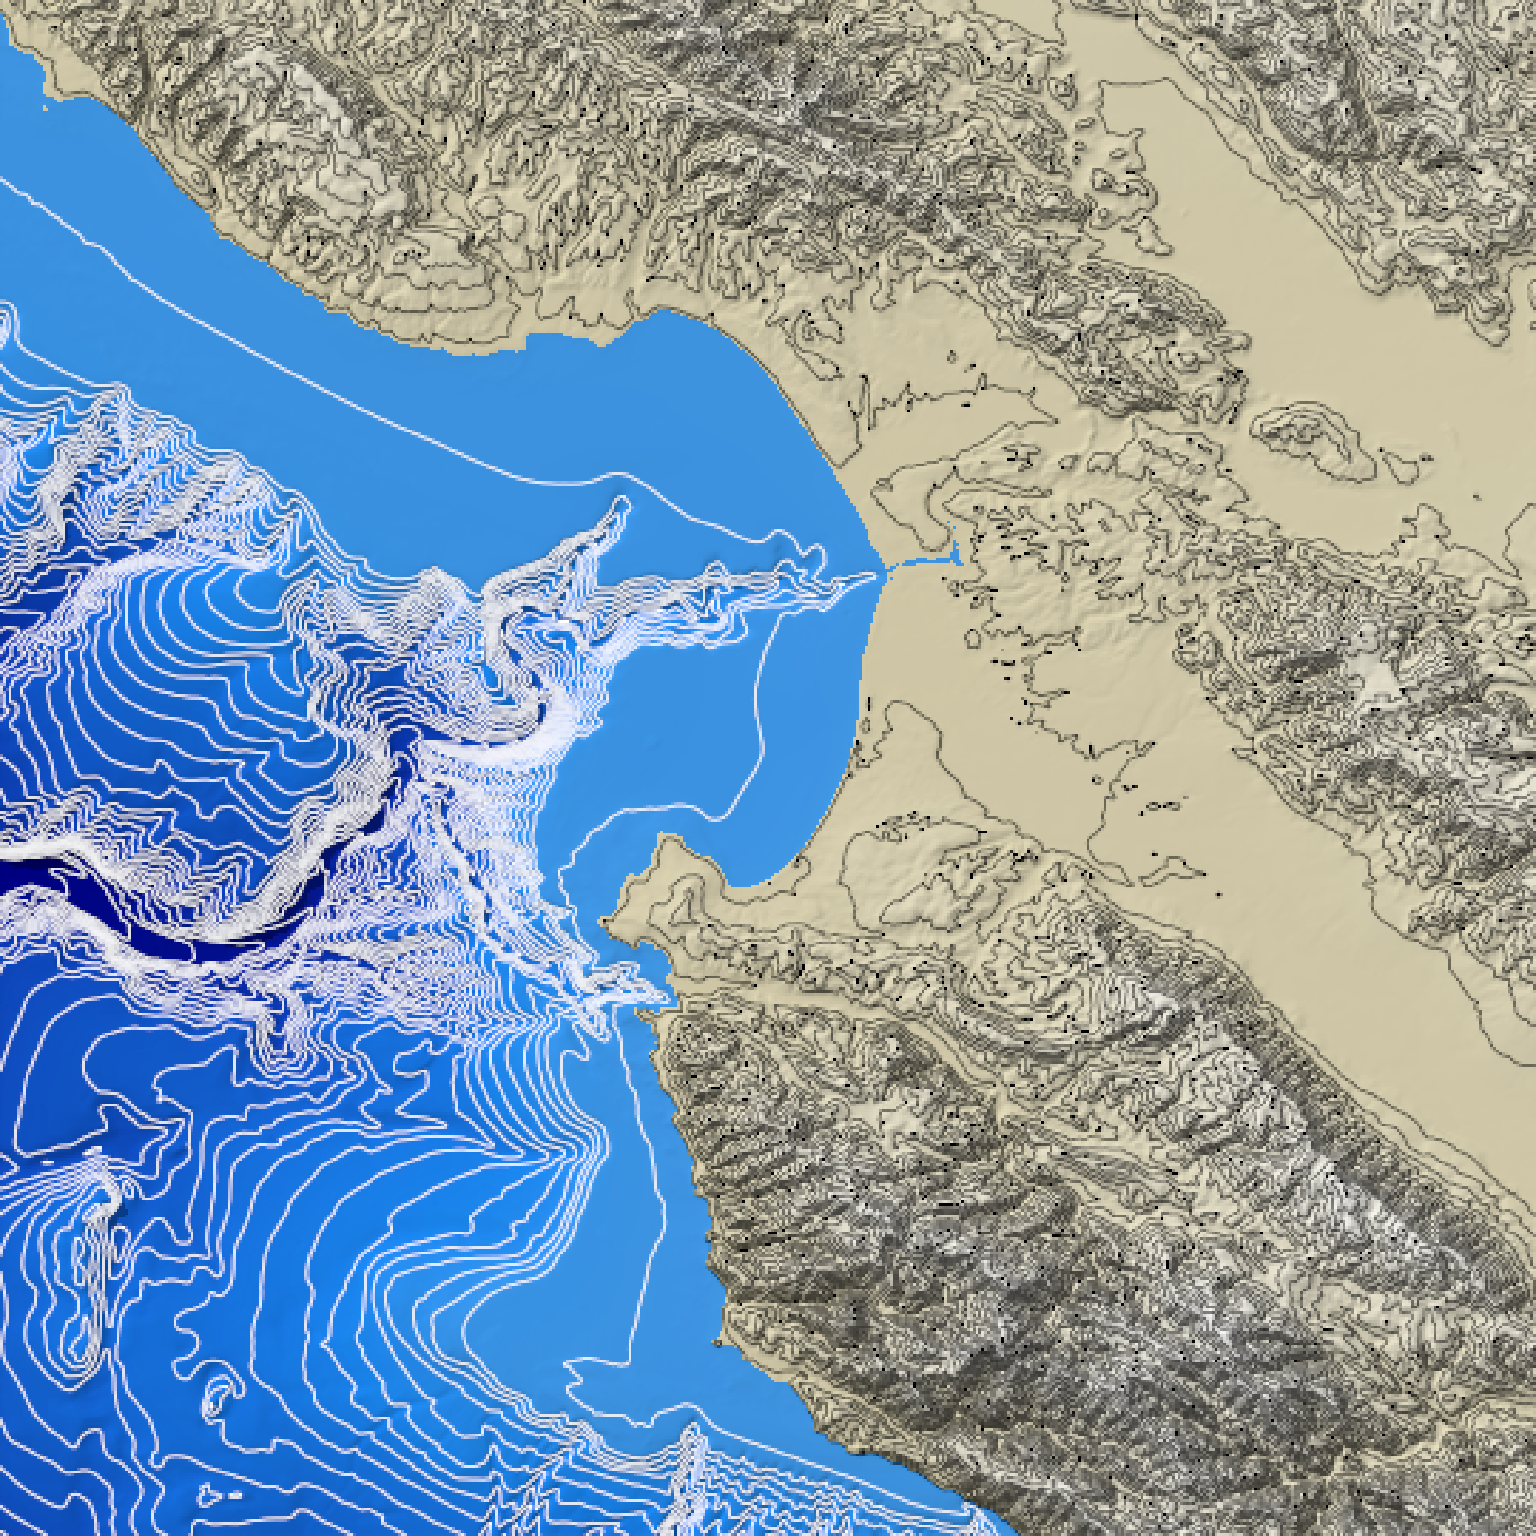
 #Add a different contour color for above and below water, and specify levels manually
water_palette = colorRampPalette(c("darkblue", "dodgerblue", "lightblue"))(200)
bathy_hs = height_shade(montereybay, texture = water_palette)
breaks = seq(range(montereybay)[1],range(montereybay)[2],length.out=50)
water_breaks = breaks[breaks < 0]
land_breaks = breaks[breaks > 0]
if(run_documentation()) {
montereybay |>
height_shade() |>
add_overlay(generate_altitude_overlay(bathy_hs, montereybay, 0, 0)) |>
add_shadow(ray_shade(montereybay,zscale=50),0.3) |>
add_overlay(generate_contour_overlay(montereybay, levels = water_breaks, color="white")) |>
add_overlay(generate_contour_overlay(montereybay, levels = land_breaks, color="black")) |>
plot_map()
}
#Add a different contour color for above and below water, and specify levels manually
water_palette = colorRampPalette(c("darkblue", "dodgerblue", "lightblue"))(200)
bathy_hs = height_shade(montereybay, texture = water_palette)
breaks = seq(range(montereybay)[1],range(montereybay)[2],length.out=50)
water_breaks = breaks[breaks < 0]
land_breaks = breaks[breaks > 0]
if(run_documentation()) {
montereybay |>
height_shade() |>
add_overlay(generate_altitude_overlay(bathy_hs, montereybay, 0, 0)) |>
add_shadow(ray_shade(montereybay,zscale=50),0.3) |>
add_overlay(generate_contour_overlay(montereybay, levels = water_breaks, color="white")) |>
add_overlay(generate_contour_overlay(montereybay, levels = land_breaks, color="black")) |>
plot_map()
}
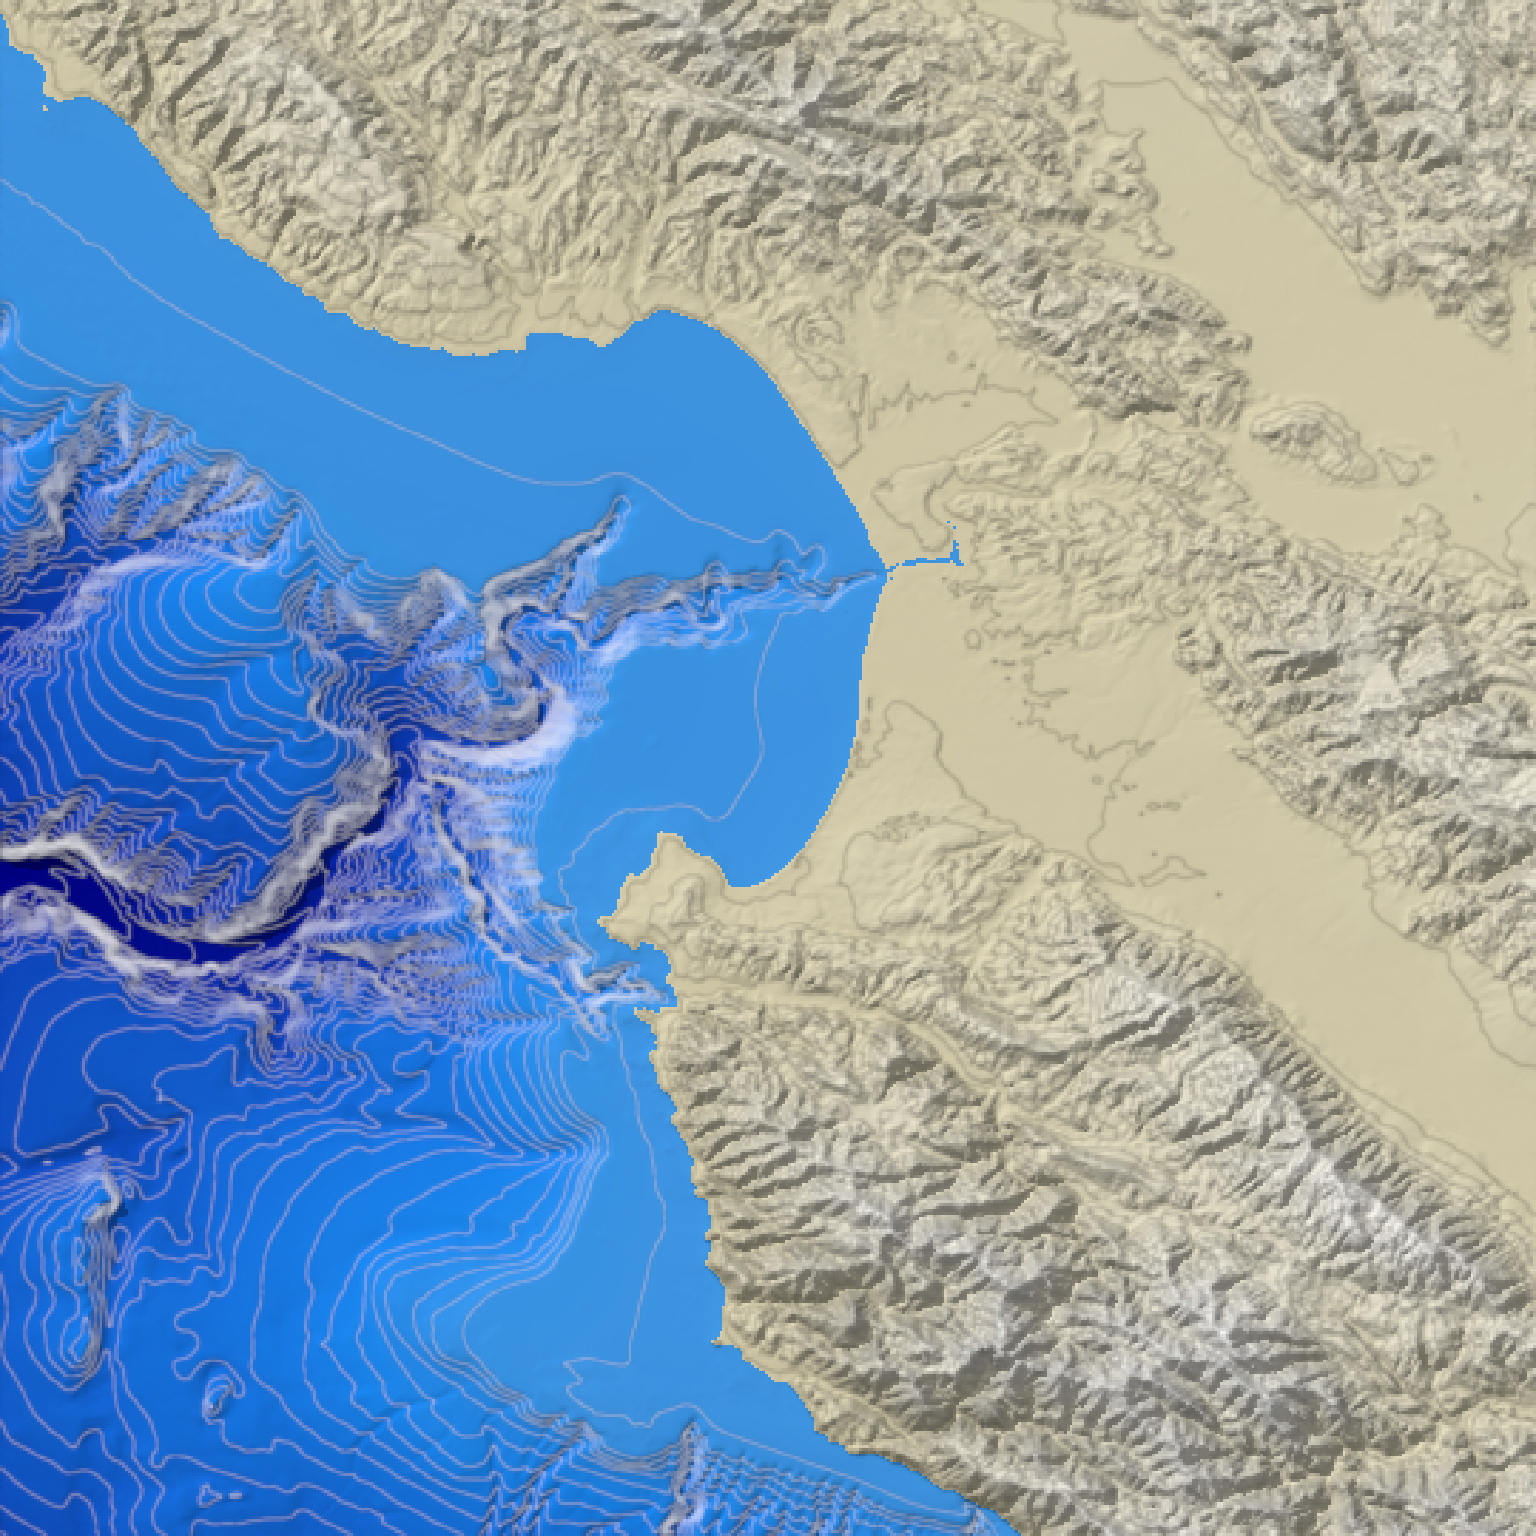
 if(run_documentation()) {
#Increase the resolution of the contour to improve the appearance of lines
montereybay |>
height_shade() |>
add_overlay(generate_altitude_overlay(bathy_hs, montereybay, 0, 0)) |>
add_shadow(ray_shade(montereybay,zscale=50),0.3) |>
add_overlay(generate_contour_overlay(montereybay, levels = water_breaks, color="white",
height = nrow(montereybay)*2,
width = ncol(montereybay)*2)) |>
add_overlay(generate_contour_overlay(montereybay, levels = land_breaks, color="black",
height = nrow(montereybay)*2,
width = ncol(montereybay)*2)) |>
plot_map()
}
if(run_documentation()) {
#Increase the resolution of the contour to improve the appearance of lines
montereybay |>
height_shade() |>
add_overlay(generate_altitude_overlay(bathy_hs, montereybay, 0, 0)) |>
add_shadow(ray_shade(montereybay,zscale=50),0.3) |>
add_overlay(generate_contour_overlay(montereybay, levels = water_breaks, color="white",
height = nrow(montereybay)*2,
width = ncol(montereybay)*2)) |>
add_overlay(generate_contour_overlay(montereybay, levels = land_breaks, color="black",
height = nrow(montereybay)*2,
width = ncol(montereybay)*2)) |>
plot_map()
}
 if(run_documentation()) {
#Increase the number of breaks and the transparency (via add_overlay)
montereybay |>
height_shade() |>
add_shadow(ray_shade(montereybay,zscale=50),0.3) |>
add_overlay(generate_contour_overlay(montereybay, linewidth=2, nlevels=100,
height = nrow(montereybay)*2, color="black",
width = ncol(montereybay)*2), alphalayer=0.5) |>
plot_map()
}
if(run_documentation()) {
#Increase the number of breaks and the transparency (via add_overlay)
montereybay |>
height_shade() |>
add_shadow(ray_shade(montereybay,zscale=50),0.3) |>
add_overlay(generate_contour_overlay(montereybay, linewidth=2, nlevels=100,
height = nrow(montereybay)*2, color="black",
width = ncol(montereybay)*2), alphalayer=0.5) |>
plot_map()
}
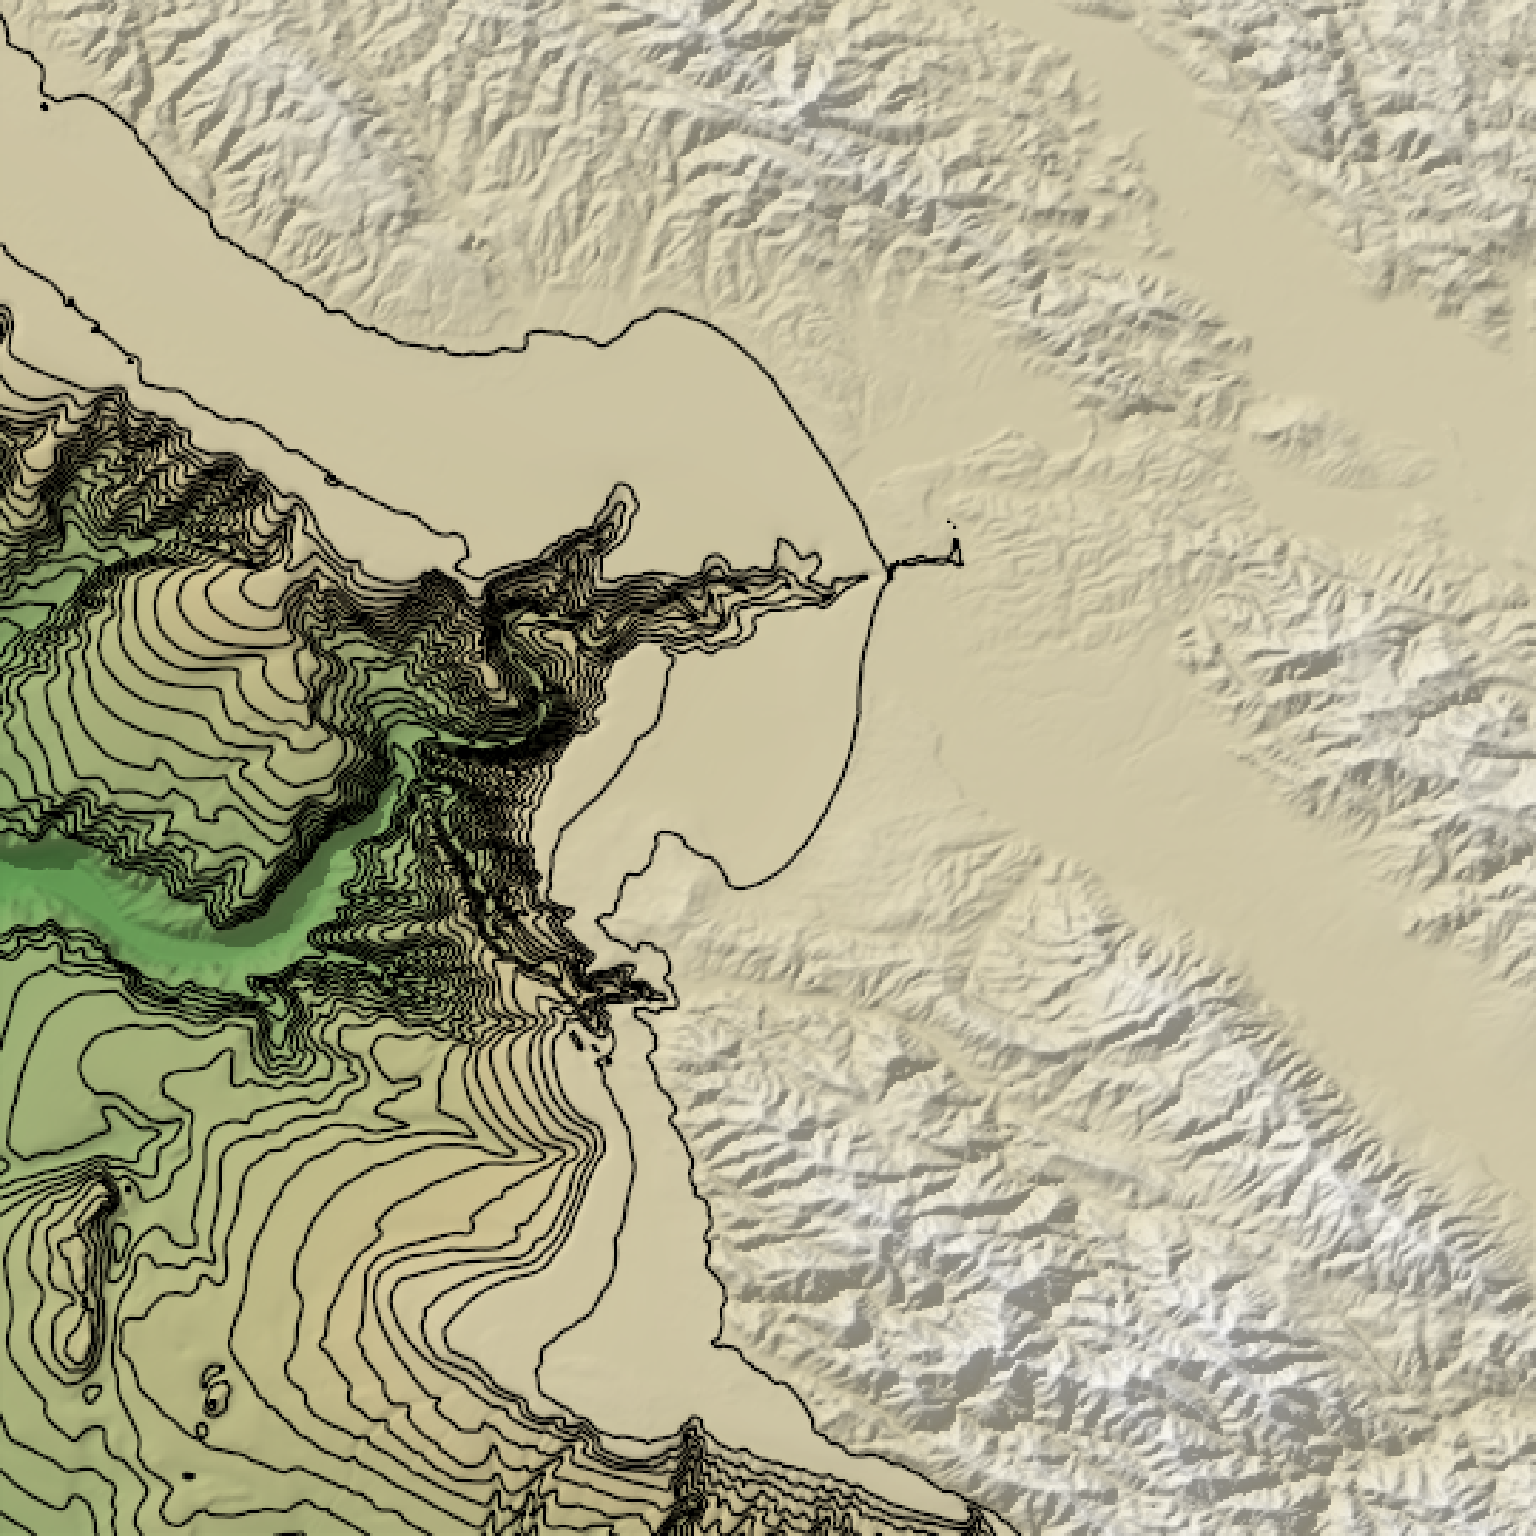
 if(run_documentation()) {
#Manually specify the breaks with levels
montereybay |>
height_shade() |>
add_overlay(generate_contour_overlay(montereybay, linewidth=2, levels = seq(-2000,0,100))) |>
add_shadow(ray_shade(montereybay,zscale=50),0.3) |>
plot_map()
}
if(run_documentation()) {
#Manually specify the breaks with levels
montereybay |>
height_shade() |>
add_overlay(generate_contour_overlay(montereybay, linewidth=2, levels = seq(-2000,0,100))) |>
add_shadow(ray_shade(montereybay,zscale=50),0.3) |>
plot_map()
}