Adds a layer of water to a map.
add_water(hillshade, watermap, color = "imhof1")Arguments
- hillshade
A three-dimensional RGB array.
- watermap
Matrix indicating whether water was detected at that point. 1 indicates water, 0 indicates no water.
- color
Default
imhof1. The water fill color. A hexcode or recognized color string. Also includes built-in colors to match the palettes included insphere_shade(): (imhof1,imhof2,imhof3,imhof4,desert,bw, andunicorn).
Examples
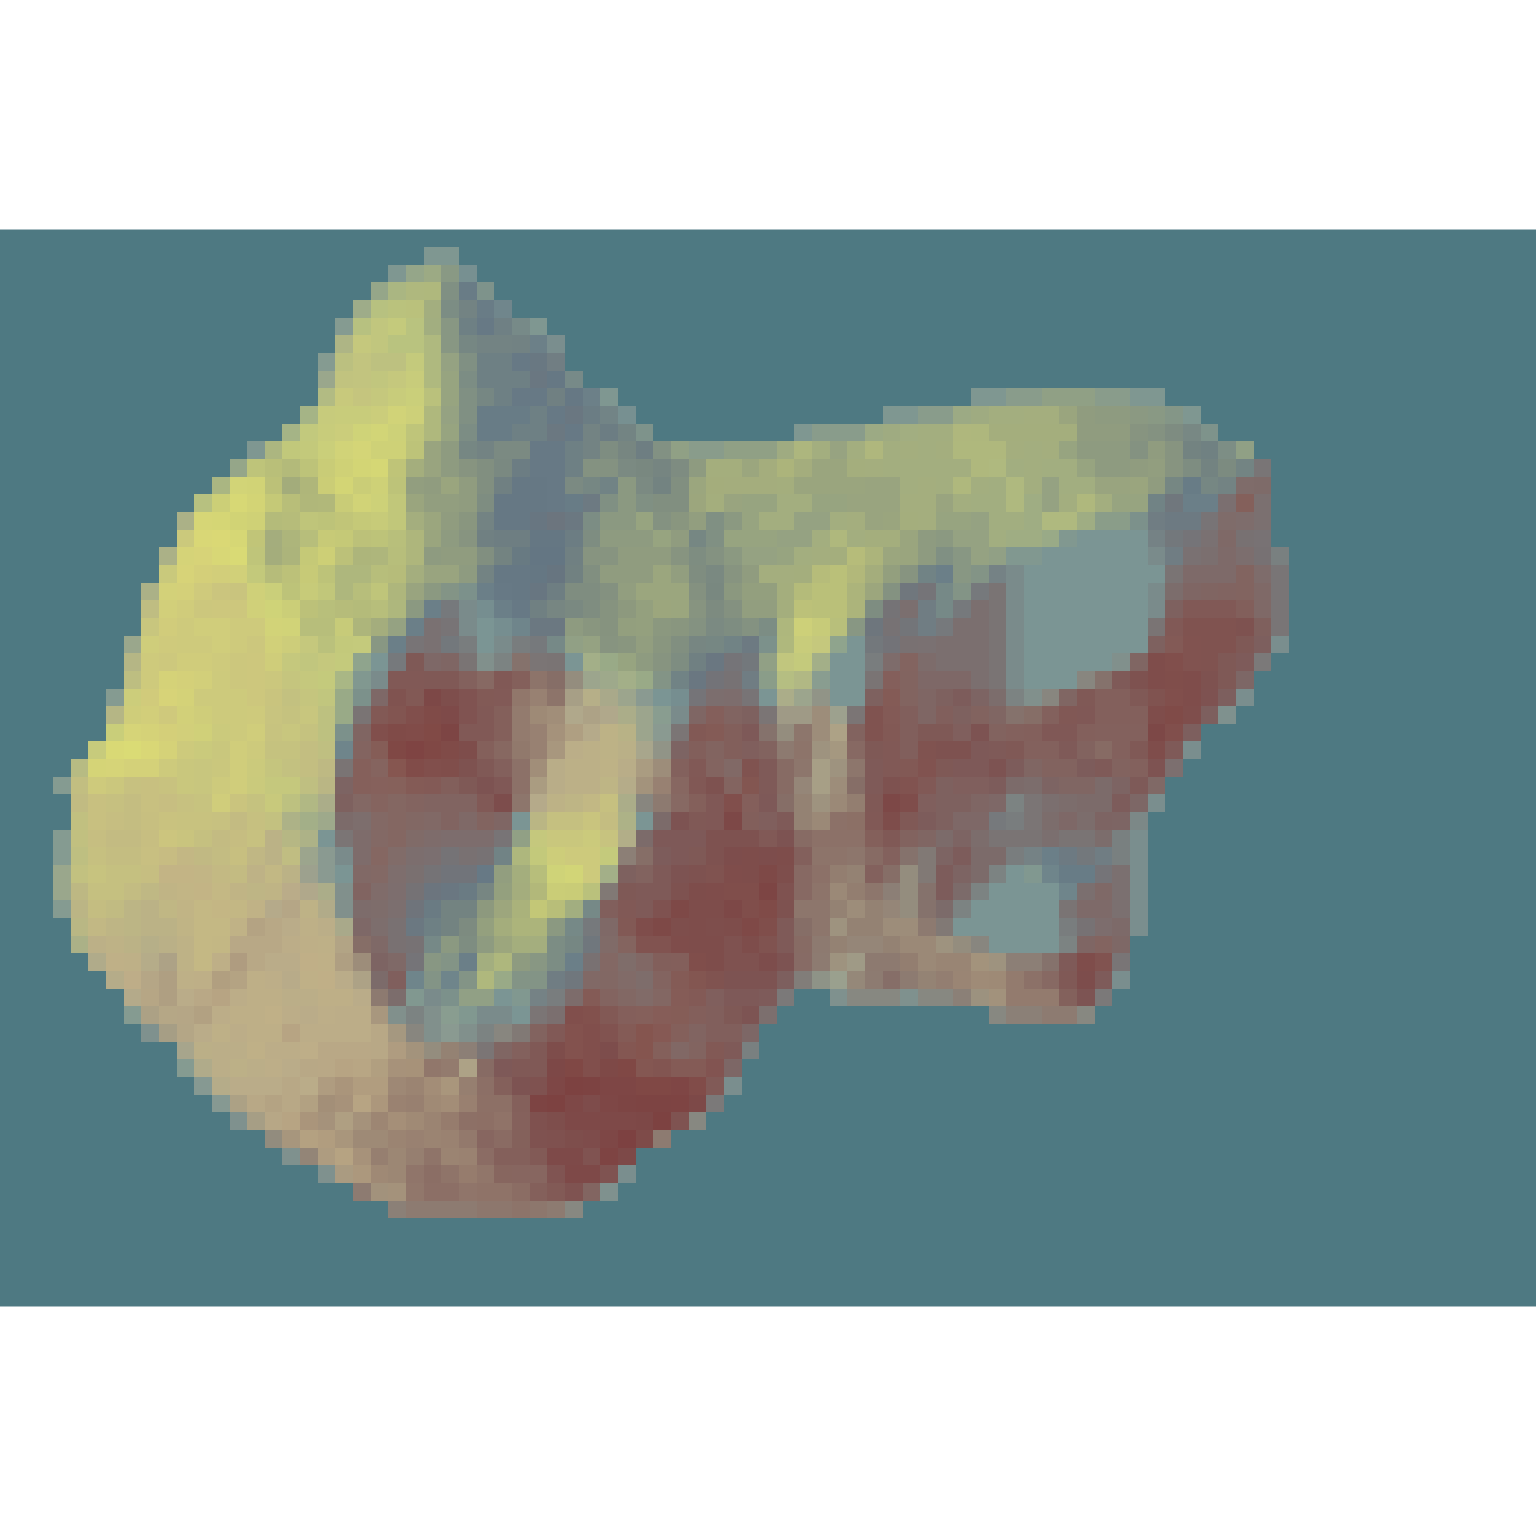
#Here we even out a portion of the volcano dataset to simulate water:
island_volcano = volcano
island_volcano[island_volcano < mean(island_volcano)] = mean(island_volcano)
#Setting a minimum area avoids classifying small flat areas as water:
if(run_documentation()) {
island_volcano |>
sphere_shade(texture="imhof3") |>
add_water(detect_water(island_volcano, min_area = 400),color="imhof3") |>
plot_map()
}
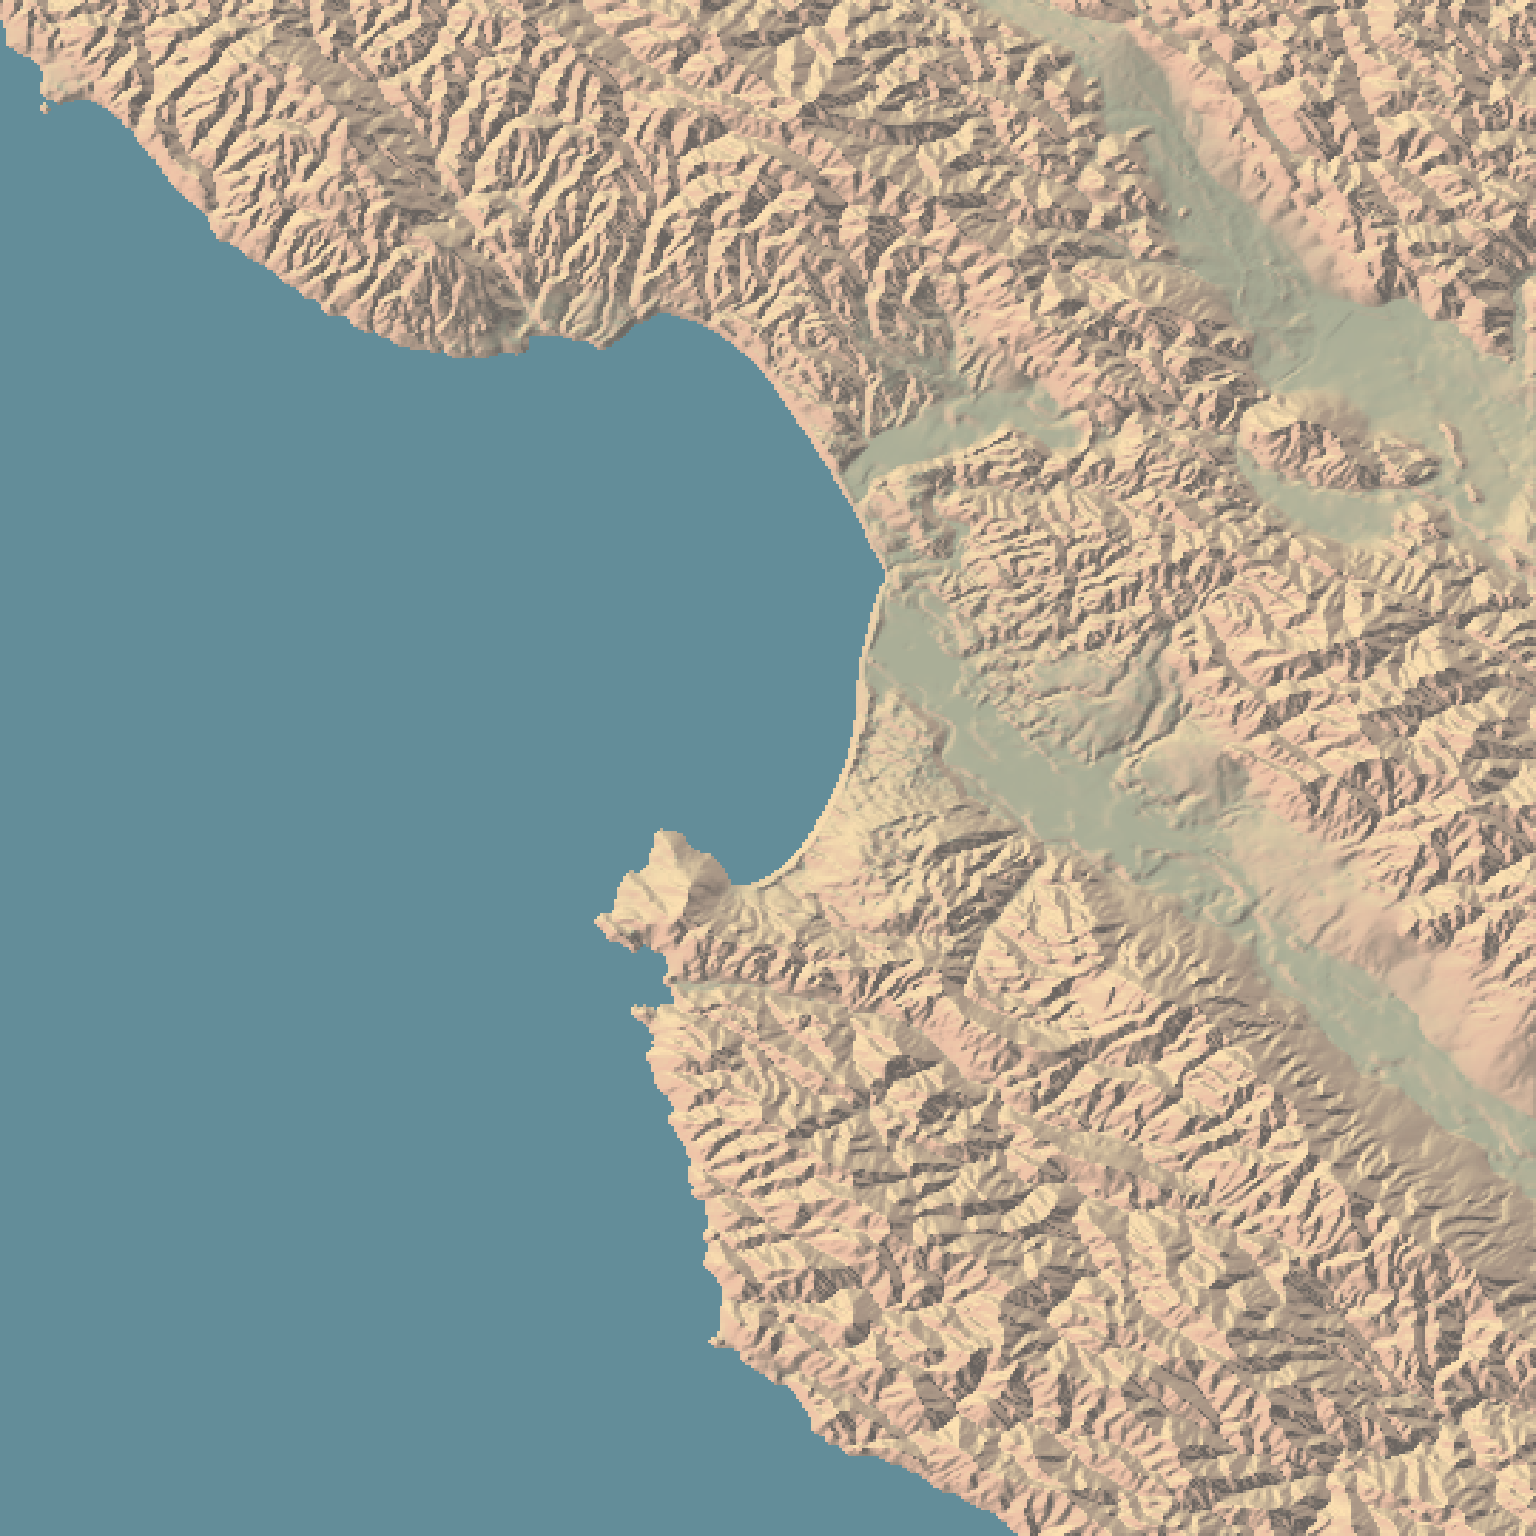
 #We'll do the same thing with the Monterey Bay dataset to fill in the ocean:
montbay_water = montereybay
montbay_water[montbay_water < 0] = 0
if(run_documentation()) {
montereybay |>
sphere_shade(texture="imhof4") |>
add_water(detect_water(montbay_water),color="imhof4") |>
plot_map()
}
#We'll do the same thing with the Monterey Bay dataset to fill in the ocean:
montbay_water = montereybay
montbay_water[montbay_water < 0] = 0
if(run_documentation()) {
montereybay |>
sphere_shade(texture="imhof4") |>
add_water(detect_water(montbay_water),color="imhof4") |>
plot_map()
}