Calculates a color for each point on the surface using the surface normals and hemispherical UV mapping. This uses either a texture map provided by the user (as an RGB array), or a built-in color texture.
sphere_shade(
  heightmap,
  sunangle = 315,
  texture = "imhof1",
  normalvectors = NULL,
  colorintensity = 1,
  zscale = 1,
  progbar = interactive()
)
Arguments
- heightmap
A two-dimensional matrix, where each entry in the matrix is the elevation at that point. All points are assumed to be evenly spaced.
- sunangle
Default
315(NW). The direction of the main highlight color (derived from the built-in palettes or thecreate_texture()function).- texture
Default
imhof1. Either a square matrix indicating the spherical texture mapping, or a string indicating one of the built-in palettes (imhof1,imhof2,imhof3,imhof4,desert,bw, andunicorn).- normalvectors
Default
NULL. Cache of the normal vectors (fromcalculate_normal()function). Supply this to speed up texture mapping.- colorintensity
Default
1. The intensity of the color mapping. Higher values will increase the intensity of the color mapping.- zscale
Default
1/colorintensity. The ratio between the x and y spacing (which are assumed to be equal) and the z axis. Ignored unlesscolorintensitymissing.- progbar
Default
TRUEif interactive,FALSEotherwise. IfFALSE, turns off progress bar.
Value
RGB array of hillshaded texture mappings.
Examples
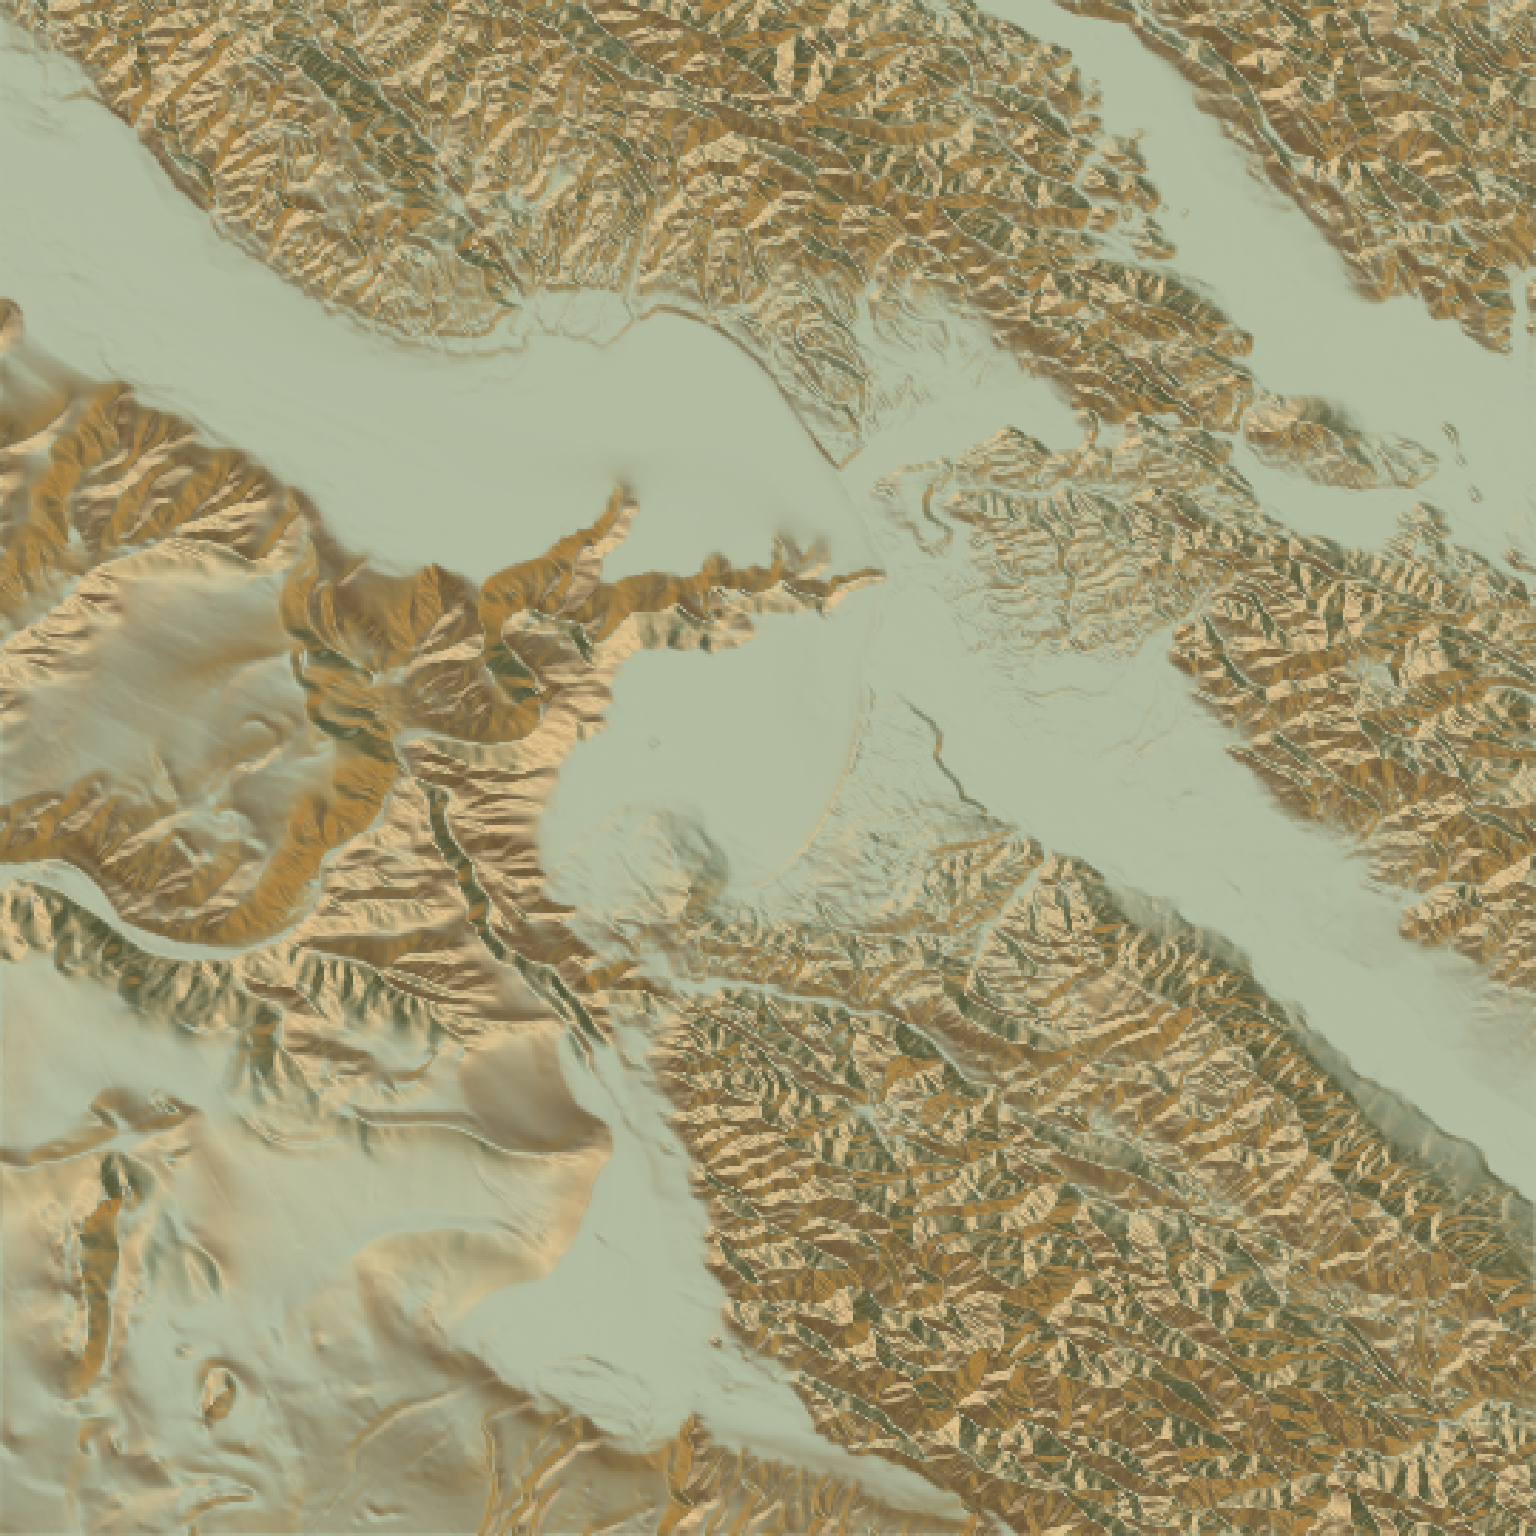
#Basic example:
montereybay |>
sphere_shade() |>
plot_map()
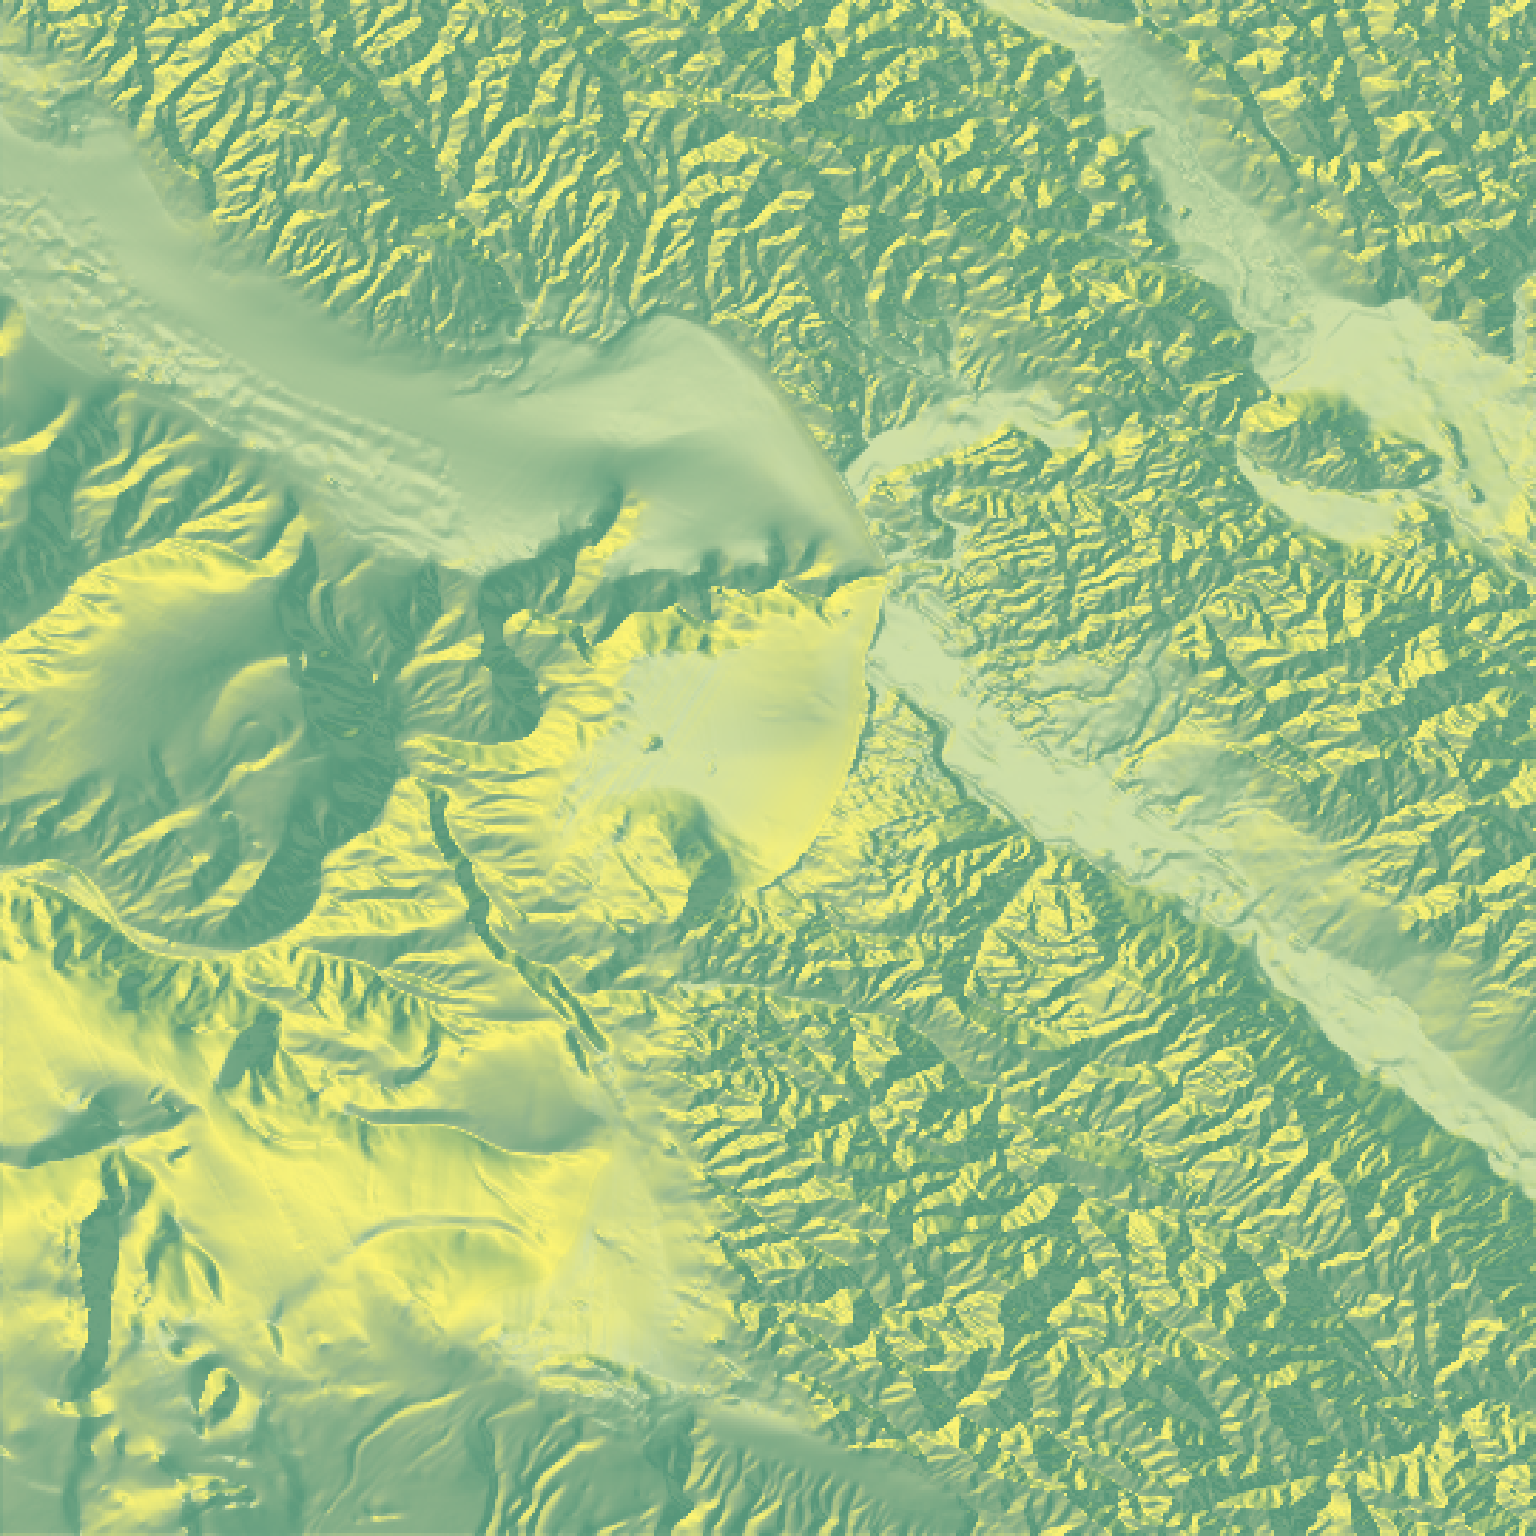 #Decrease the color intensity:
montereybay |>
sphere_shade(colorintensity=0.1) |>
plot_map()
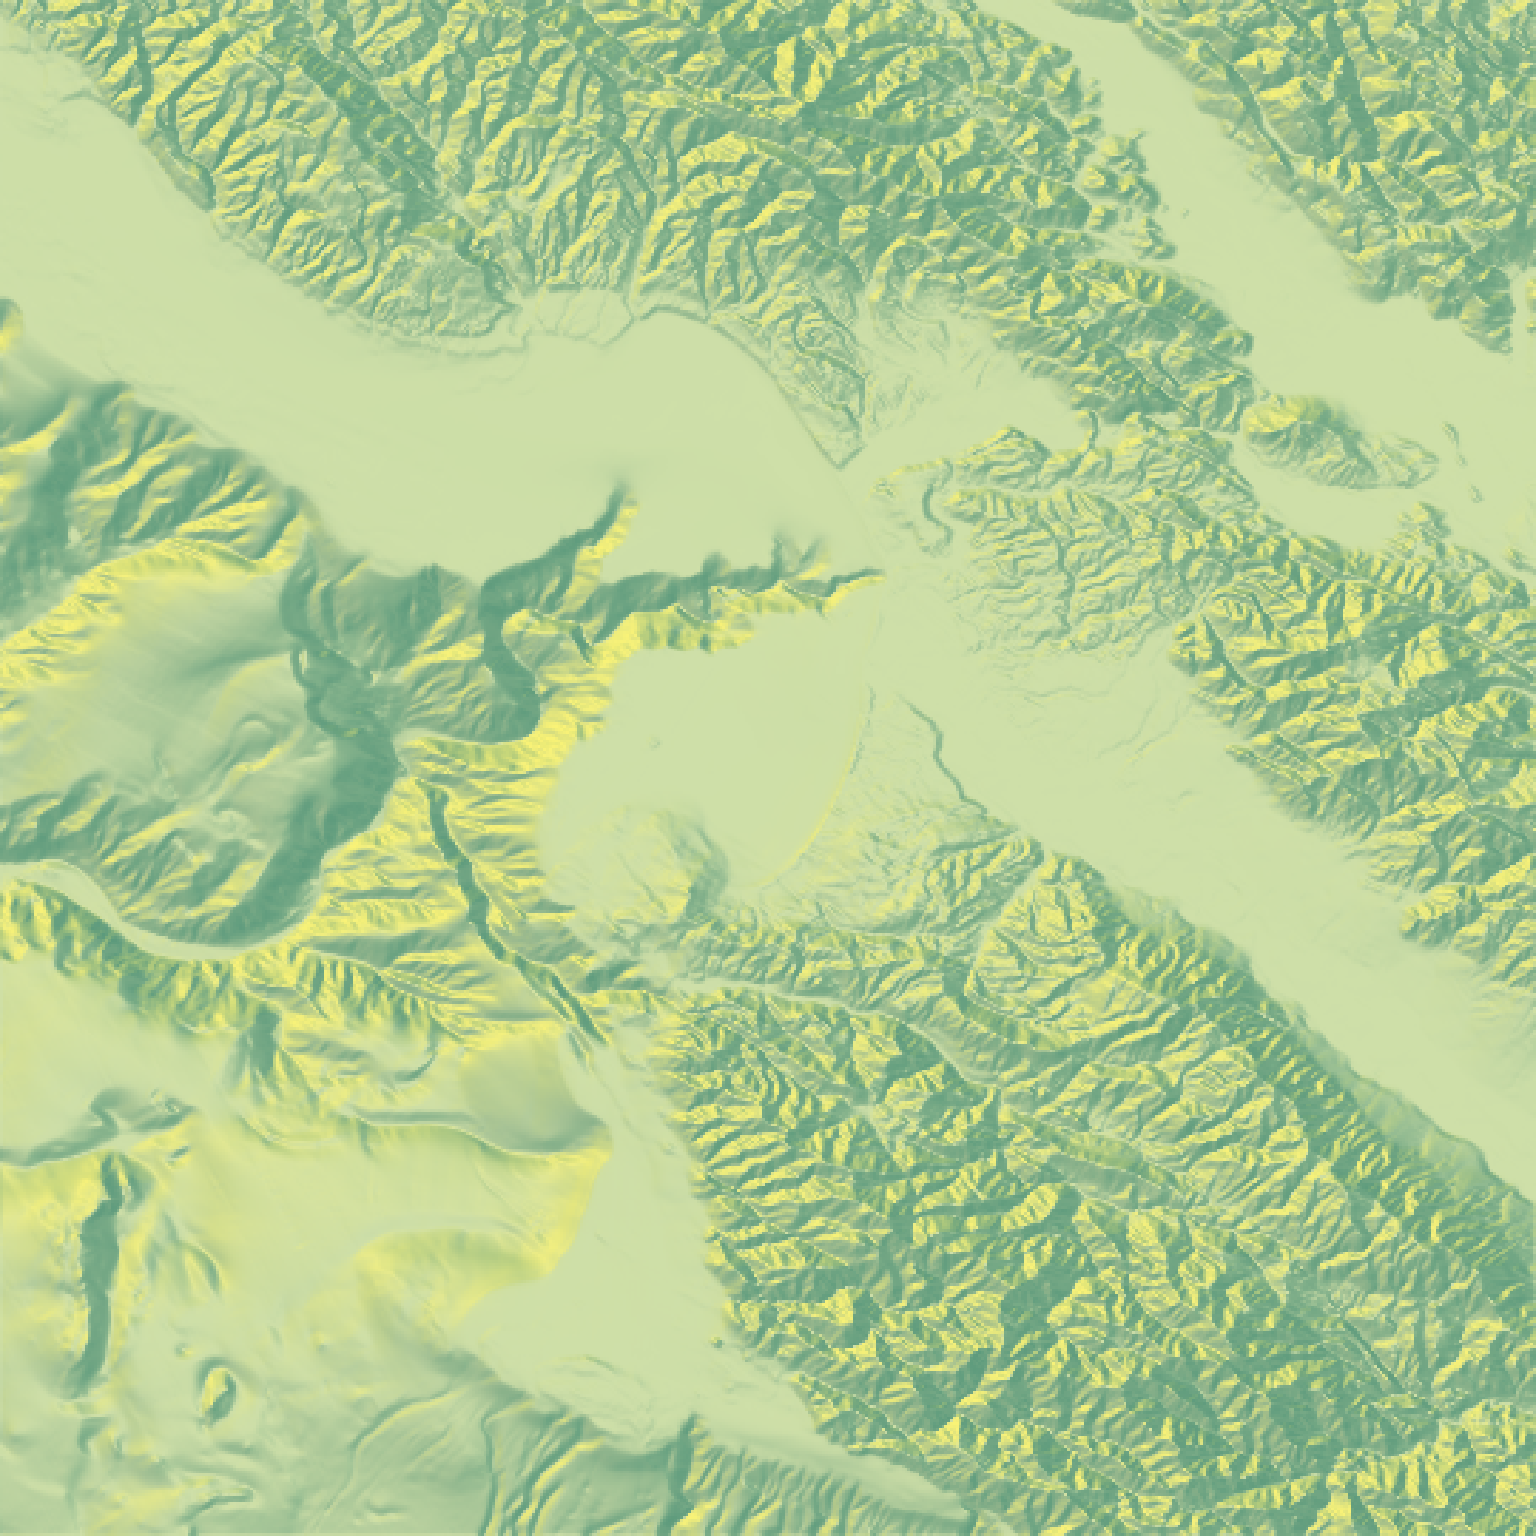
#Decrease the color intensity:
montereybay |>
sphere_shade(colorintensity=0.1) |>
plot_map()
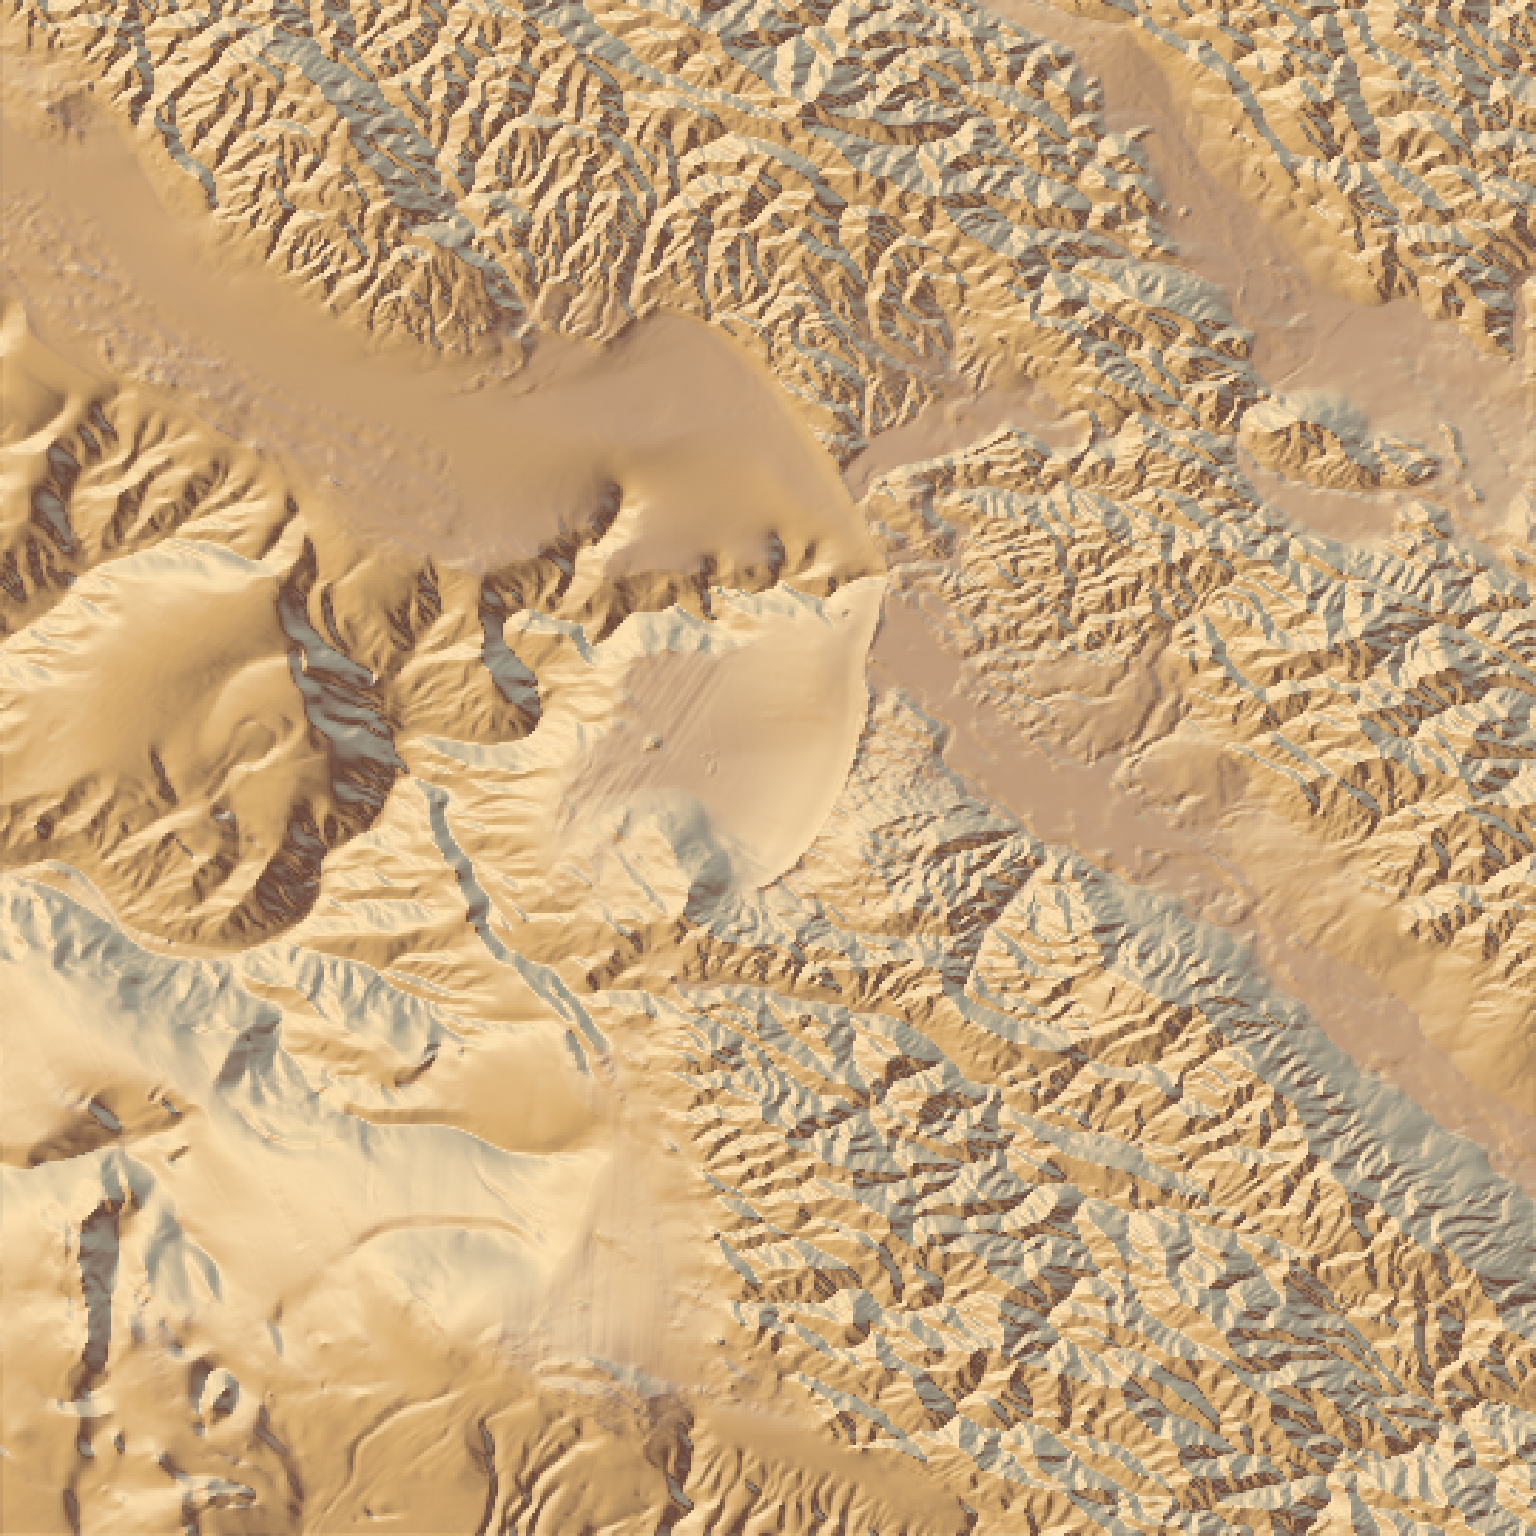
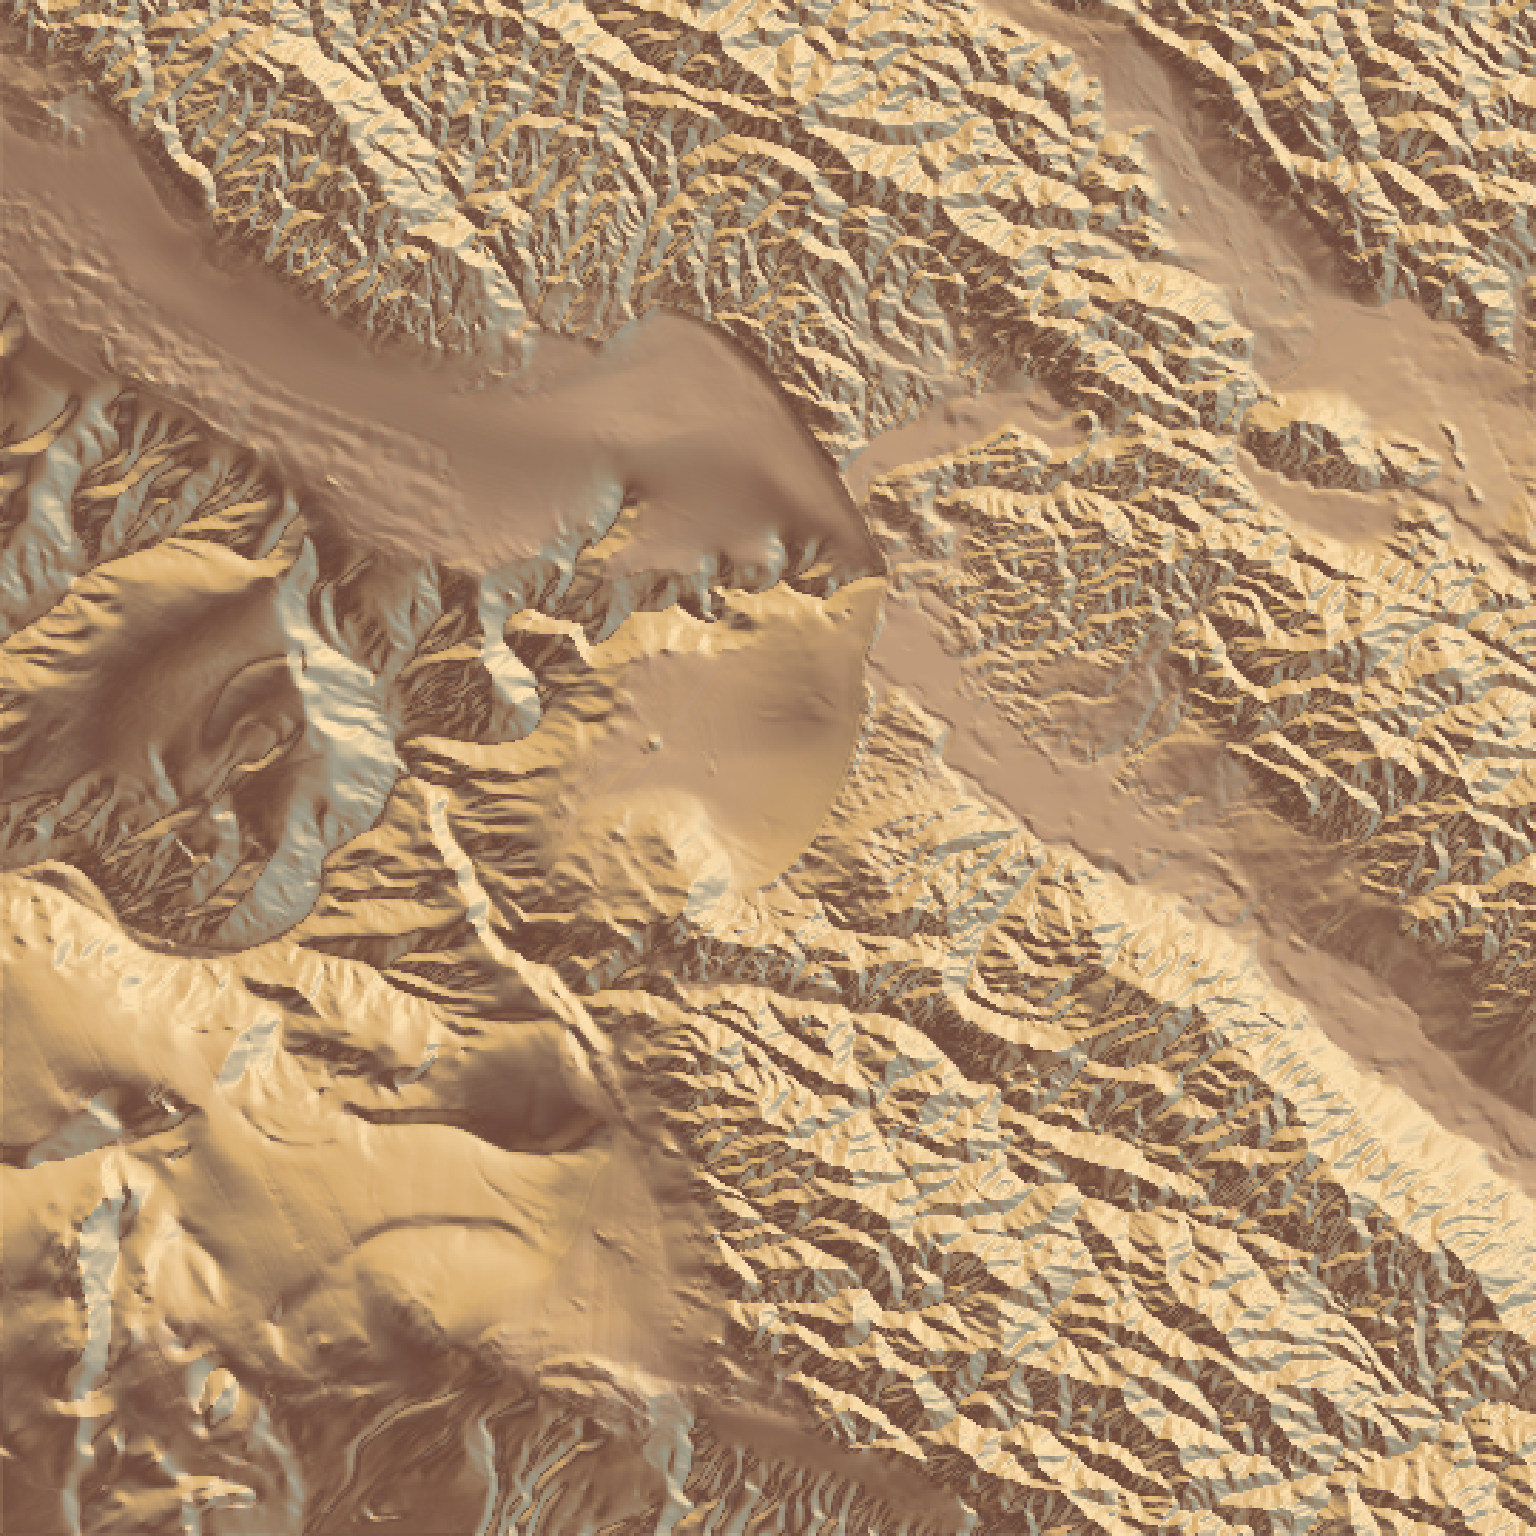
 #Change to a built-in color texture:
montereybay |>
sphere_shade(texture="desert") |>
plot_map()
#Change to a built-in color texture:
montereybay |>
sphere_shade(texture="desert") |>
plot_map()
 #Change the highlight angle:
montereybay |>
sphere_shade(texture="desert", sunangle = 45) |>
plot_map()
#Change the highlight angle:
montereybay |>
sphere_shade(texture="desert", sunangle = 45) |>
plot_map()
 #Create our own texture using the `create_texture` function:
montereybay |>
sphere_shade(zscale=10,texture=create_texture("#E9C68D","#AF7F38",
"#674F30","#494D30",
"#B3BEA3")) |>
plot_map()
#Create our own texture using the `create_texture` function:
montereybay |>
sphere_shade(zscale=10,texture=create_texture("#E9C68D","#AF7F38",
"#674F30","#494D30",
"#B3BEA3")) |>
plot_map()