Plots a ggplot2 object in 3D by mapping the color or fill aesthetic to elevation.
Currently, this function does not transform lines mapped to color into 3D.
If there are multiple legends/guides due to multiple aesthetics being mapped (e.g. color and shape), the package author recommends that the user pass the order of the guides manually using the ggplot2 function "guides()`. Otherwise, the order may change when processing the ggplot2 object and result in a mismatch between the 3D mapping and the underlying plot.
Using the shape aesthetic with more than three groups is not recommended, unless the user passes in custom, solid shapes. By default in ggplot2, only the first three shapes are solid, which is a requirement to be projected into 3D.
plot_gg(
  ggobj,
  ggobj_height = NULL,
  width = 3,
  height = 3,
  height_aes = NULL,
  invert = FALSE,
  shadow_intensity = 0.5,
  units = c("in", "cm", "mm"),
  scale = 150,
  pointcontract = 0.7,
  offset_edges = FALSE,
  flat_plot_render = FALSE,
  flat_distance = "auto",
  flat_transparent_bg = FALSE,
  flat_direction = "-z",
  shadow = TRUE,
  shadowdepth = "auto",
  shadowcolor = "auto",
  shadow_darkness = 0.5,
  background = "white",
  preview = FALSE,
  raytrace = TRUE,
  sunangle = 315,
  anglebreaks = seq(30, 40, 0.1),
  multicore = FALSE,
  lambert = TRUE,
  triangulate = FALSE,
  max_error = 0.001,
  max_tri = 0,
  verbose = FALSE,
  emboss_text = 0,
  emboss_grid = 0,
  reduce_size = NULL,
  save_height_matrix = FALSE,
  save_shadow_matrix = FALSE,
  saved_shadow_matrix = NULL,
  monitor_gamma = 1.8,
  plot = TRUE,
  ...
)
Arguments
- ggobj
ggplot object to projected into 3D.
- ggobj_height
Default
NULL. A ggplot object that can be used to specify the 3D extrusion separately from theggobj.- width
Default
3. Width of ggplot, inunits.- height
Default
3. Height of ggplot, inunits.- height_aes
Default
NULL. Whether thefillorcoloraesthetic should be used for height values, which the user can specify by passing eitherfillorcolorto this argument. Automatically detected. If bothfillandcoloraesthetics are present, thenfillis default.- invert
Default
FALSE. IfTRUE, the height mapping is inverted.- shadow_intensity
Default
0.5. The intensity of the calculated shadows.- units
Default
in. One of c("in", "cm", "mm").- scale
Default
150. Multiplier for vertical scaling: a higher number increases the height of the 3D transformation.- pointcontract
Default
0.7. This multiplies the size of the points and shrinks them around their center in the 3D surface mapping. Decrease this to reduce color bleed on edges, and set to1to turn off entirely. Note: Ifsizeis passed as an aesthetic to the same geom that is being mapped to elevation, this scaling will not be applied. Ifalphavaries on the variable being mapped, you may want to set this to1, since the points now have a non-zero width stroke outline (however, mappingalphain the same variable you are projecting to height is probably not a good choice. as thealphavariable is ignored when performing the 3D projection).- offset_edges
Default
FALSE. IfTRUE, inserts a small amount of space between polygons for "geom_sf", "geom_tile", "geom_hex", and "geom_polygon" layers. If you pass in a number, the space between polygons will be a line of that width. You can also specify a number to control the thickness of the offset. Note: this feature may end up removing thin polygons from the plot entirely–use with care.- flat_plot_render
Default
FALSE. Whether to render a flat version of the ggplot above (or alongside) the 3D version.- flat_distance
Default
"auto". Distance to render the flat version of the plot from the 3D version.- flat_transparent_bg
Default
FALSE. Whether to set the background of the flat version of the ggplot to transparent.- flat_direction
Default
"-z". Direction to render the flat copy of the plot, ifflat_plot_render = TRUE. Other optionsc("z", "x", "-x", "y", "-y").- shadow
Default
TRUE. IfFALSE, no shadow is rendered.- shadowdepth
Default
auto, which sets it tosoliddepth - soliddepth/10. Depth of the shadow layer.- shadowcolor
Default
auto. Color of the shadow, automatically computed asshadow_darknessthe luminance of thebackgroundcolor in the CIELab colorspace if not specified.- shadow_darkness
Default
0.5. Darkness of the shadow, ifshadowcolor = "auto".- background
Default
"white". Background color.- preview
Default
FALSE. IfTRUE, the raytraced 2D ggplot will be displayed on the current device.- raytrace
Default
FALSE. Whether to add a raytraced layer.- sunangle
Default
315(NW). If raytracing, the angle (in degrees) around the matrix from which the light originates.- anglebreaks
Default
seq(30,40,0.1). The azimuth angle(s), in degrees, as measured from the horizon from which the light originates.- multicore
Default
FALSE. If raytracing andTRUE, multiple cores will be used to compute the shadow matrix. By default, this uses all cores available, unless the user has setoptions("cores")in which the multicore option will only use that many cores.- lambert
Default
TRUE. If raytracing, changes the intensity of the light at each point based proportional to the dot product of the ray direction and the surface normal at that point. Zeros out all values directed away from the ray.- triangulate
Default
FALSE. Reduce the size of the 3D model by triangulating the height map. Set this toTRUEif generating the model is slow, or moving it is choppy. Will also reduce the size of 3D models saved to disk.- max_error
Default
0.001. Maximum allowable error when triangulating the height map, whentriangulate = TRUE. Increase this if you encounter problems with 3D performance, want to decrease render time withrender_highquality(), or need to save a smaller 3D OBJ file to disk withsave_obj(),- max_tri
Default
0, which turns this setting off and usesmax_error. Maximum number of triangles allowed with triangulating the height map, whentriangulate = TRUE. Increase this if you encounter problems with 3D performance, want to decrease render time withrender_highquality(), or need to save a smaller 3D OBJ file to disk withsave_obj(),- verbose
Default
TRUE, ifinteractive(). Prints information about the mesh triangulation iftriangulate = TRUE.- emboss_text
Default
0, max1. Amount to emboss the text, where1is the tallest feature in the scene.- emboss_grid
Default
0, max1. Amount to emboss the grid lines, where1is the tallest feature in the scene. By default, the minor grid lines will be half the size of the major lines. Pass a length-2 vector to specify them seperately (second value is the minor grid height).- reduce_size
Default
NULL. A number between0and1that specifies how much to reduce the resolution of the plot, for faster plotting. By default, this just decreases the size of height map, not the image. If you wish the image to be reduced in resolution as well, pass a numeric vector of size 2.- save_height_matrix
Default
FALSE. IfTRUE, the function will return the height matrix used for the ggplot.- save_shadow_matrix
Default
FALSE. IfTRUE, the function will return the shadow matrix for use in future updates via theshadow_cacheargument passed toray_shade().- saved_shadow_matrix
Default
NULL. A cached shadow matrix (saved by the a previous invocation ofplot_gg()withsave_shadow_matrix = TRUE) to use instead of raytracing a shadow map each time.- monitor_gamma
Default
1.8. Undo the gamma correction applied by the png device. Ignored ifraggis installed or thecairoPNG device is available.- plot
Default
TRUE. Whether to plot the image whenpreview = TRUE, or just return the RGBA rayimg.- ...
Additional arguments to be passed to
plot_3d().
Value
Opens a 3D plot in rgl.
Examples
library(ggplot2)
library(viridis)
#> Loading required package: viridisLite
ggdiamonds = ggplot(diamonds, aes(x, depth)) +
stat_density_2d(aes(fill = after_stat(nlevel), color = after_stat(nlevel)),
geom = "polygon",
n = 200, bins = 50,contour = TRUE) +
facet_wrap(clarity~.) +
scale_fill_viridis_c(option = "A") +
scale_color_viridis_c(option = "A")
if(run_documentation()) {
plot_gg(ggdiamonds,multicore = TRUE,width=5,height=5,scale=250,windowsize=c(1400,866),
zoom = 0.55, phi = 30)
render_snapshot()
}
 #Change the camera angle and take a snapshot:
if(run_documentation()) {
render_camera(zoom=0.5,theta=-30,phi=30)
render_snapshot()
}
#Change the camera angle and take a snapshot:
if(run_documentation()) {
render_camera(zoom=0.5,theta=-30,phi=30)
render_snapshot()
}
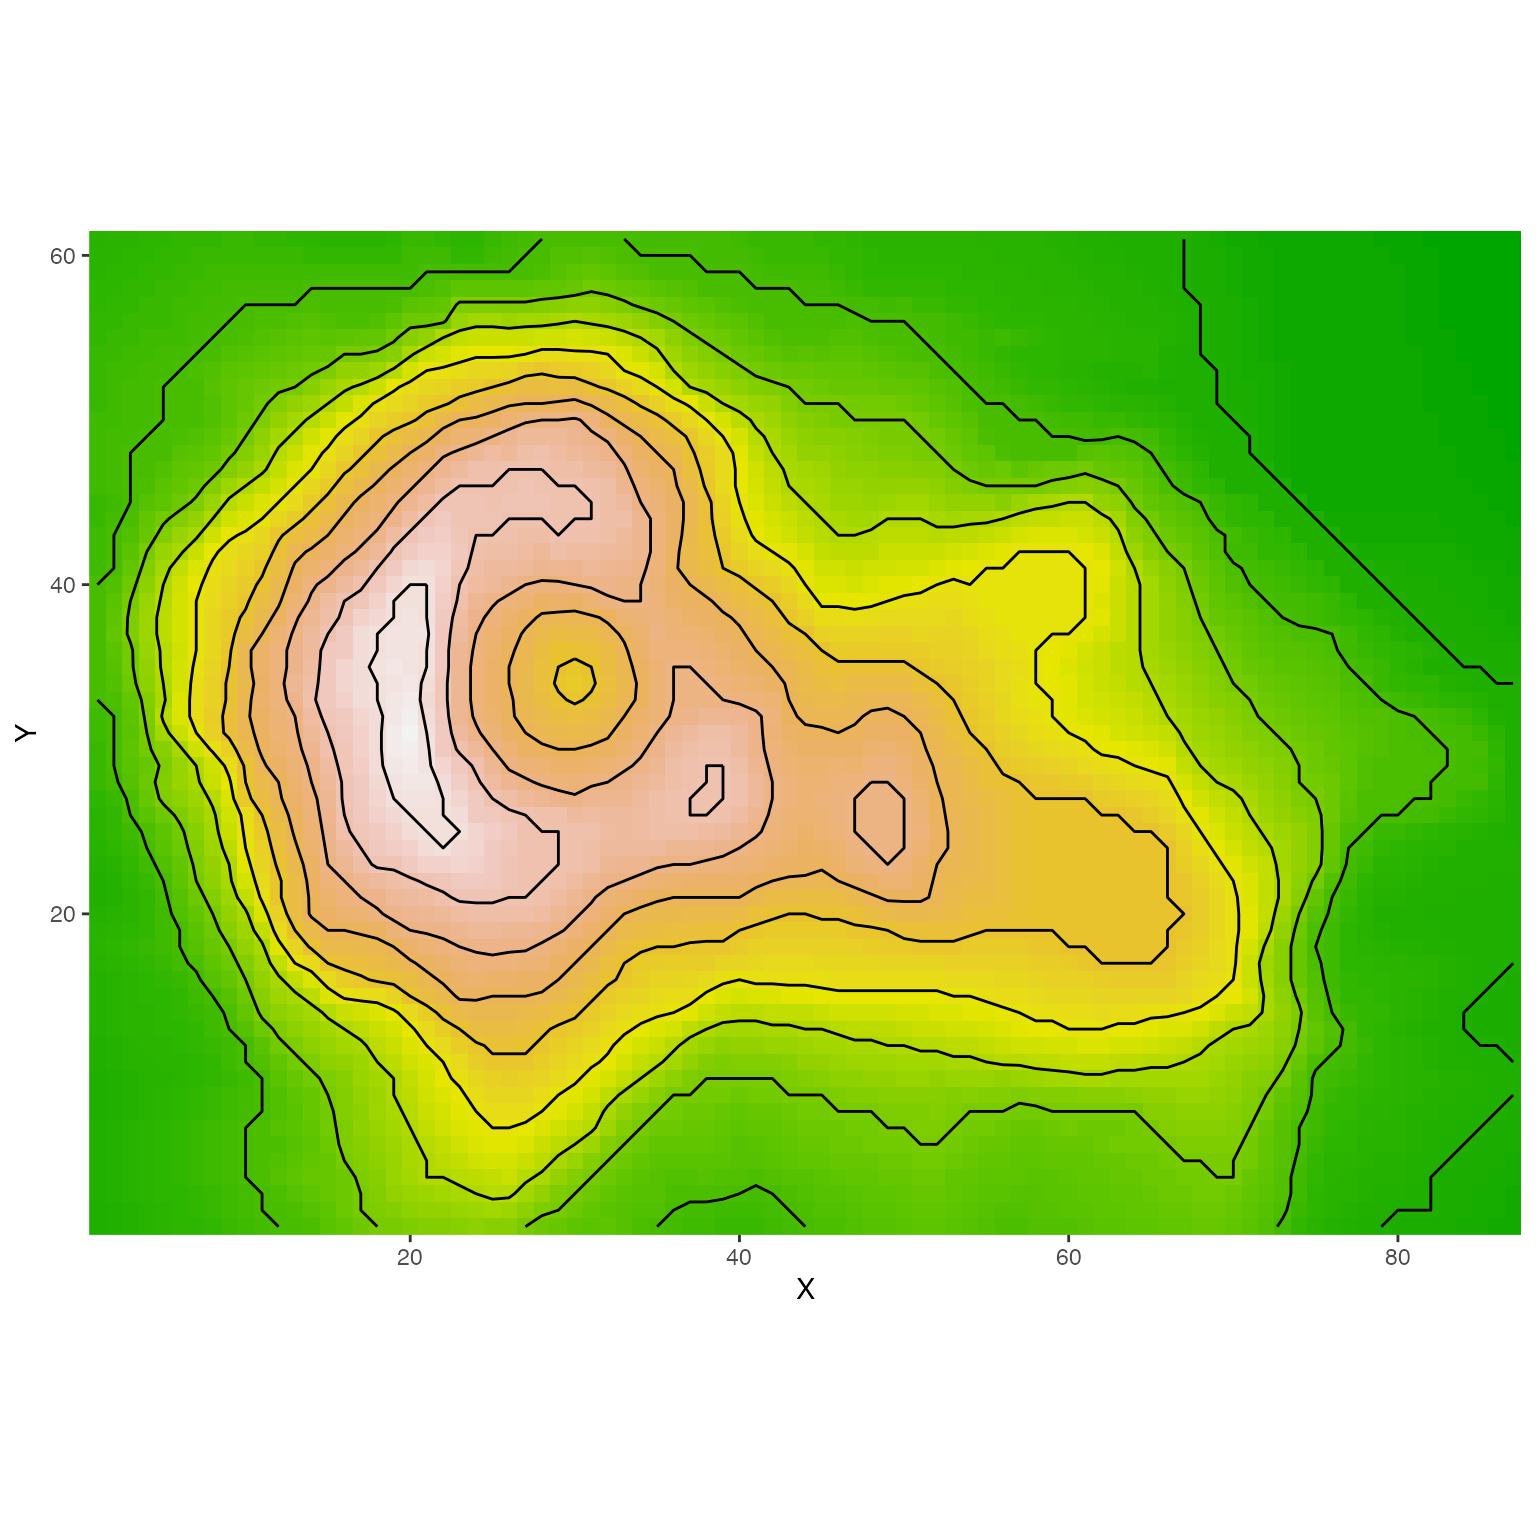
 #Contours and other lines will automatically be ignored. Here is the volcano dataset:
ggvolcano = volcano |>
reshape2::melt() |>
ggplot() +
geom_tile(aes(x=Var1,y=Var2,fill=value)) +
geom_contour(aes(x=Var1,y=Var2,z=value),color="black") +
scale_x_continuous("X",expand = c(0,0)) +
scale_y_continuous("Y",expand = c(0,0)) +
scale_fill_gradientn("Z",colours = terrain.colors(10)) +
coord_fixed() +
theme(legend.position = "none")
ggvolcano
#Contours and other lines will automatically be ignored. Here is the volcano dataset:
ggvolcano = volcano |>
reshape2::melt() |>
ggplot() +
geom_tile(aes(x=Var1,y=Var2,fill=value)) +
geom_contour(aes(x=Var1,y=Var2,z=value),color="black") +
scale_x_continuous("X",expand = c(0,0)) +
scale_y_continuous("Y",expand = c(0,0)) +
scale_fill_gradientn("Z",colours = terrain.colors(10)) +
coord_fixed() +
theme(legend.position = "none")
ggvolcano
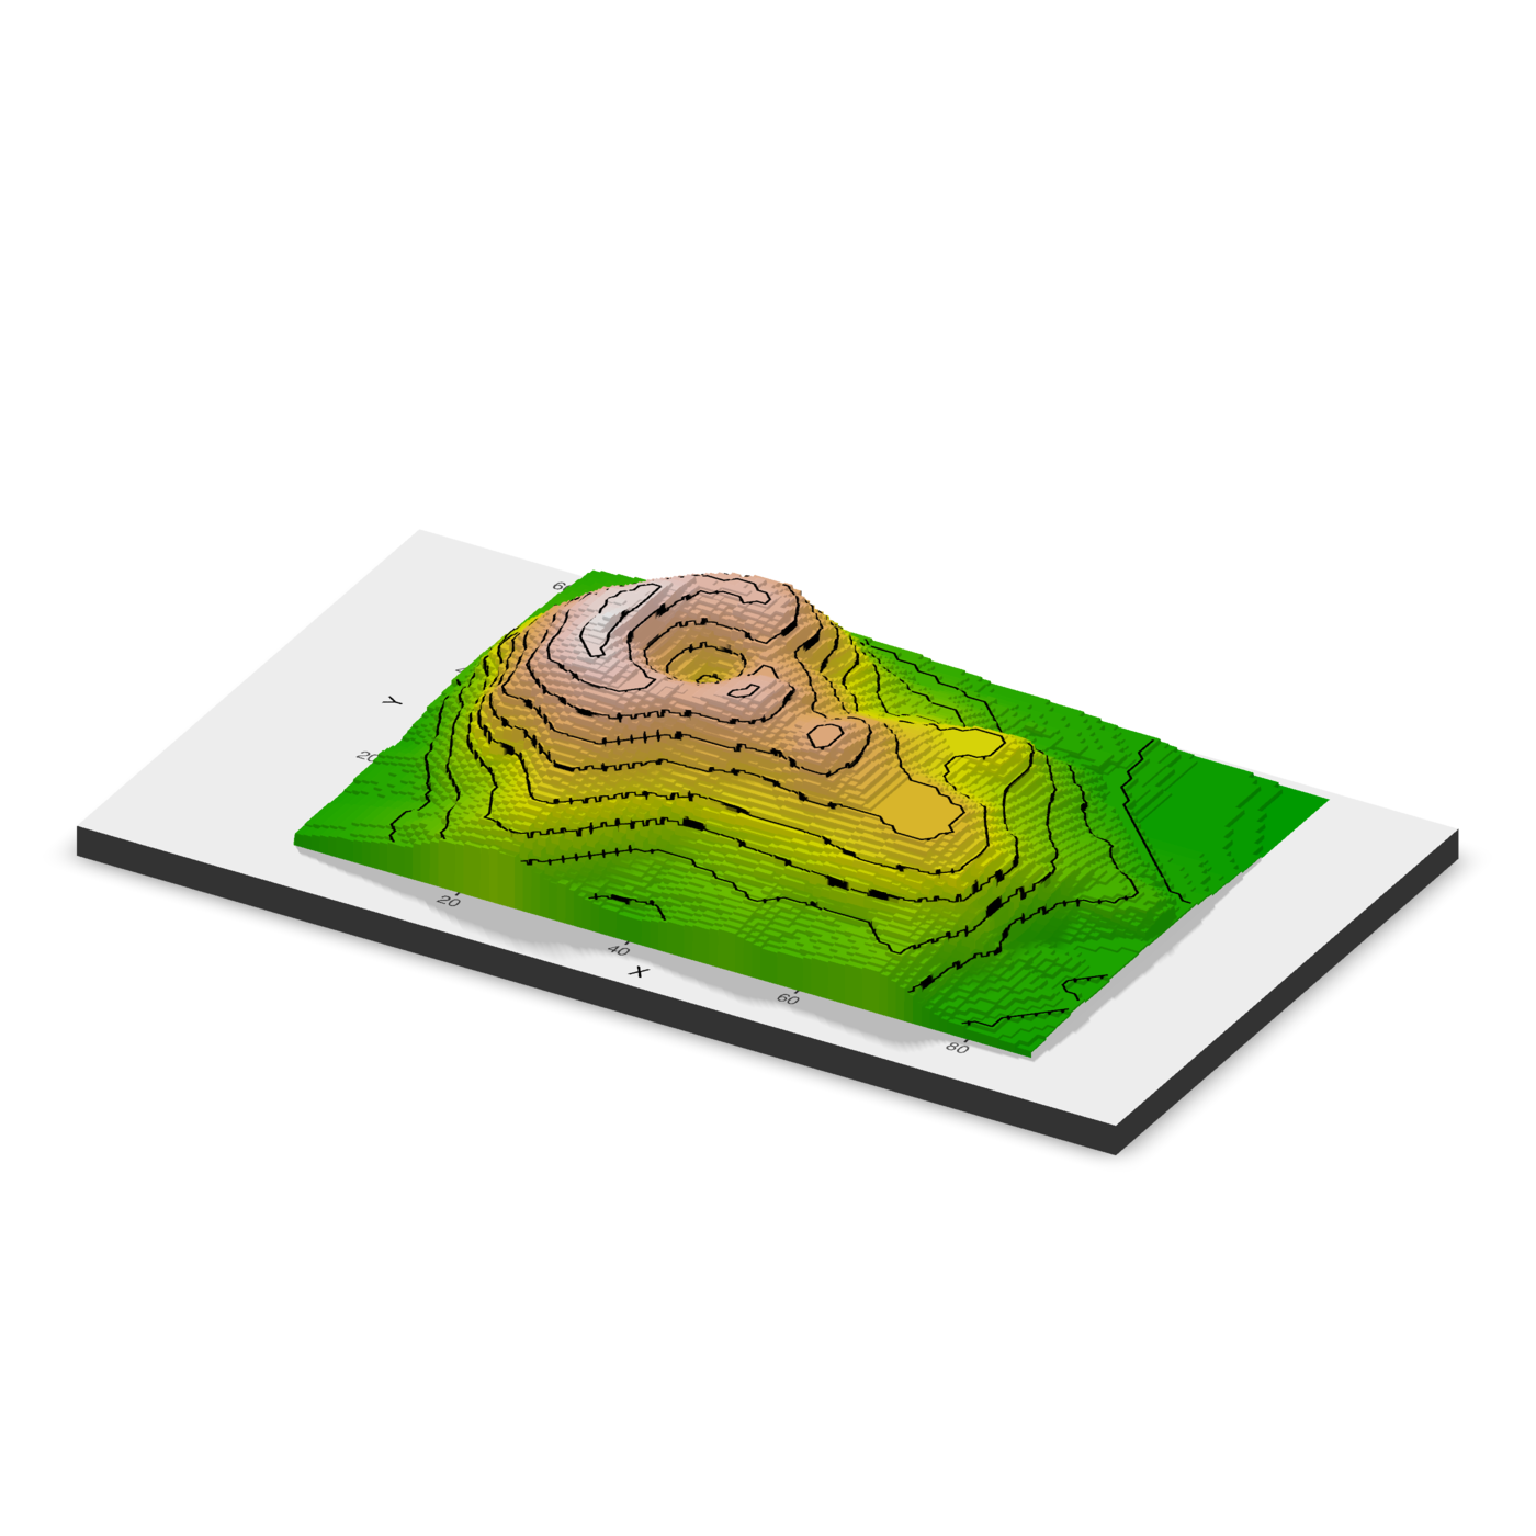
 if(run_documentation()) {
plot_gg(ggvolcano, multicore = TRUE, raytrace = TRUE, width = 7, height = 4,
scale = 300, windowsize = c(1400, 866), zoom = 0.6, phi = 30, theta = 30)
render_snapshot()
}
#> Warning: Removed 1861 rows containing missing values or values outside the scale range
#> (`geom_contour()`).
if(run_documentation()) {
plot_gg(ggvolcano, multicore = TRUE, raytrace = TRUE, width = 7, height = 4,
scale = 300, windowsize = c(1400, 866), zoom = 0.6, phi = 30, theta = 30)
render_snapshot()
}
#> Warning: Removed 1861 rows containing missing values or values outside the scale range
#> (`geom_contour()`).
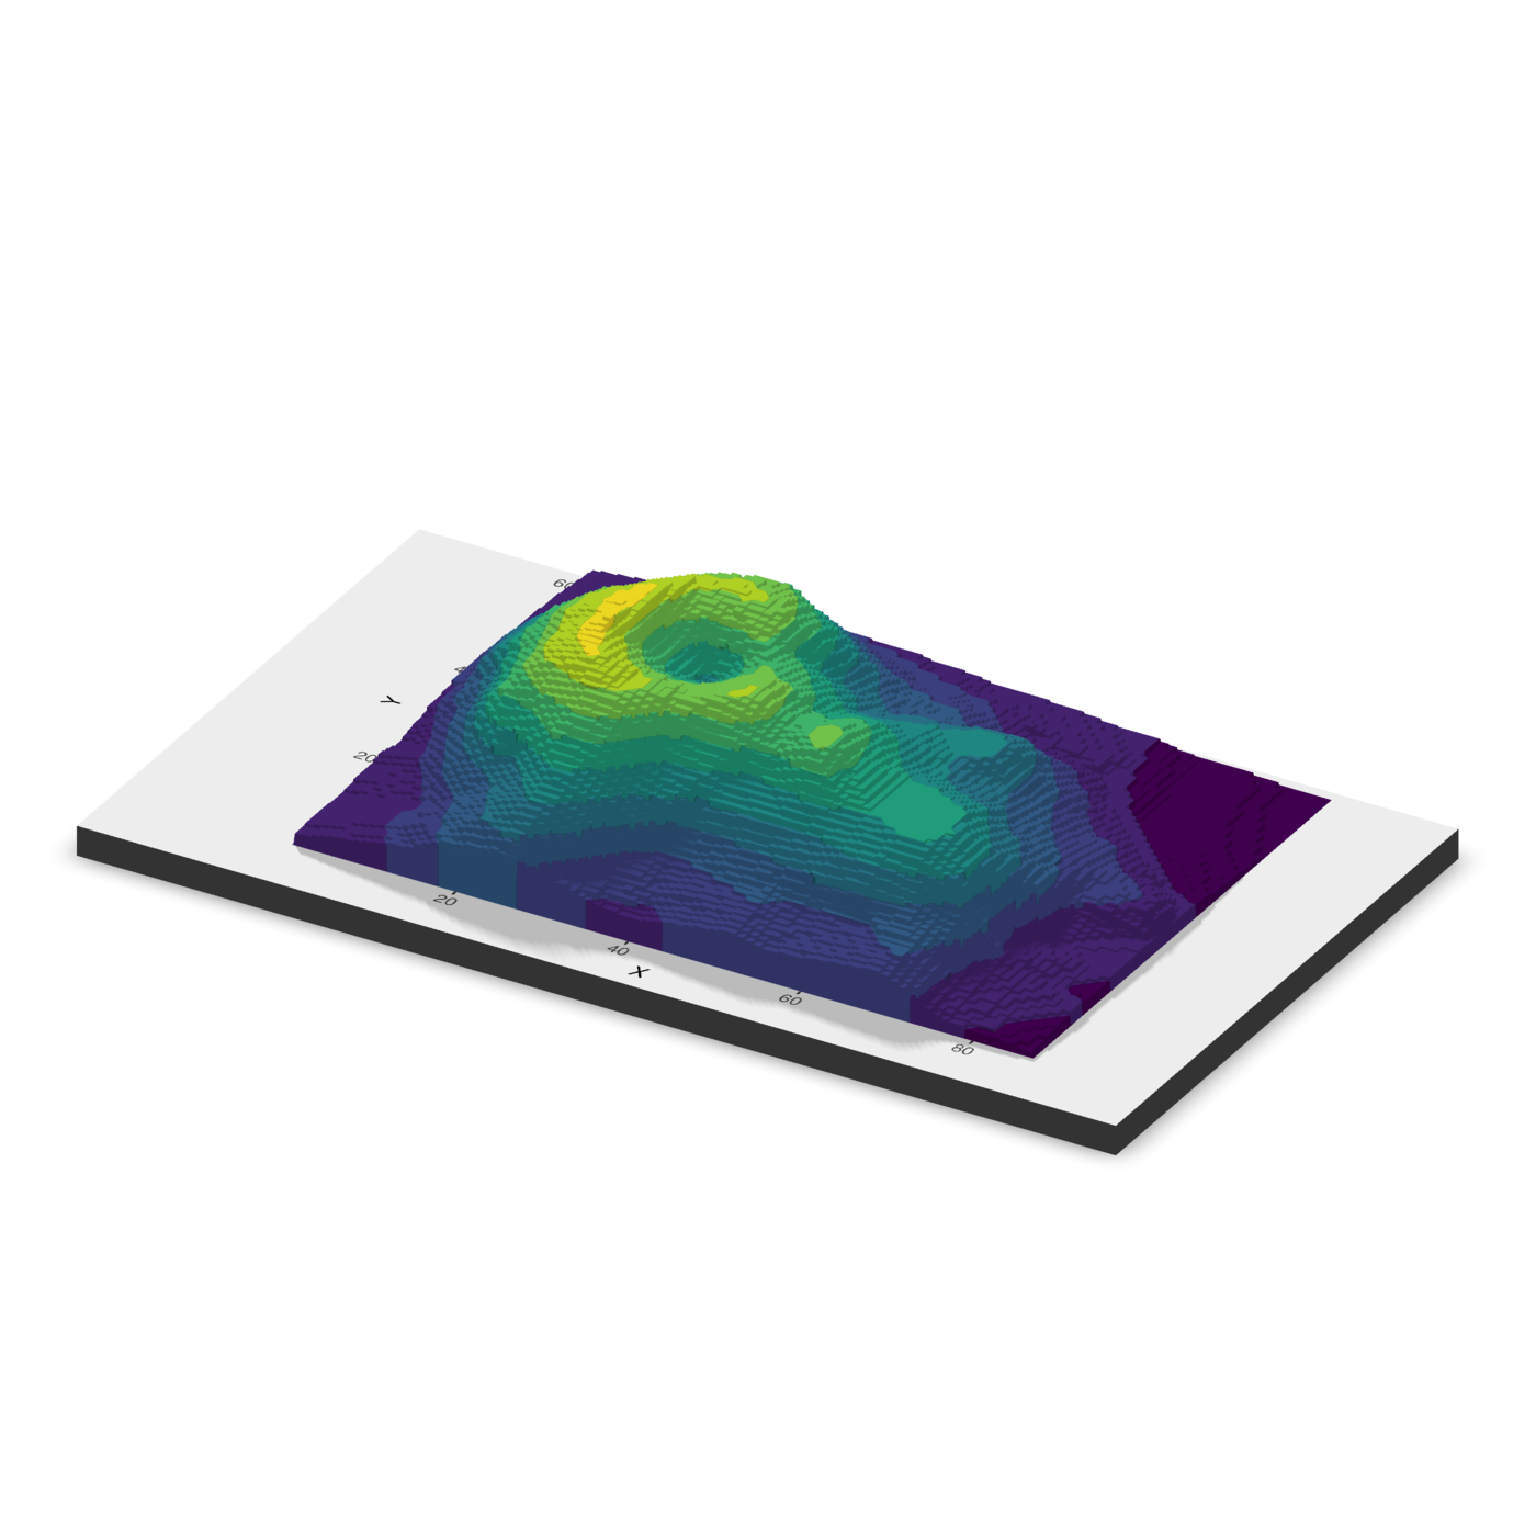
 if(run_documentation()) {
#You can specify the color and height separately using the `ggobj_height()` argument.
ggvolcano_surface = volcano |>
reshape2::melt() |>
ggplot() +
geom_contour(aes(x=Var1,y=Var2,z=value),color="black") +
geom_contour_filled(aes(x=Var1,y=Var2,z=value))+
scale_x_continuous("X",expand = c(0,0)) +
scale_y_continuous("Y",expand = c(0,0)) +
coord_fixed() +
theme(legend.position = "none")
plot_gg(ggvolcano_surface, ggobj_height = ggvolcano,
multicore = TRUE, raytrace = TRUE, width = 7, height = 4,
scale = 300, windowsize = c(1400, 866), zoom = 0.6, phi = 30, theta = 30)
render_snapshot()
}
#> Warning: Removed 1861 rows containing missing values or values outside the scale range
#> (`geom_contour()`).
if(run_documentation()) {
#You can specify the color and height separately using the `ggobj_height()` argument.
ggvolcano_surface = volcano |>
reshape2::melt() |>
ggplot() +
geom_contour(aes(x=Var1,y=Var2,z=value),color="black") +
geom_contour_filled(aes(x=Var1,y=Var2,z=value))+
scale_x_continuous("X",expand = c(0,0)) +
scale_y_continuous("Y",expand = c(0,0)) +
coord_fixed() +
theme(legend.position = "none")
plot_gg(ggvolcano_surface, ggobj_height = ggvolcano,
multicore = TRUE, raytrace = TRUE, width = 7, height = 4,
scale = 300, windowsize = c(1400, 866), zoom = 0.6, phi = 30, theta = 30)
render_snapshot()
}
#> Warning: Removed 1861 rows containing missing values or values outside the scale range
#> (`geom_contour()`).
 #Here, we will create a 3D plot of the mtcars dataset. This automatically detects
#that the user used the `color` aesthetic instead of the `fill`.
mtplot = ggplot(mtcars) +
geom_point(aes(x=mpg,y=disp,color=cyl)) +
scale_color_continuous(limits=c(0,8))
#Preview how the plot will look by setting `preview = TRUE`: We also adjust the angle of the light.
if(run_documentation()) {
plot_gg(mtplot, width=3.5, sunangle=225, preview = TRUE)
}
#Here, we will create a 3D plot of the mtcars dataset. This automatically detects
#that the user used the `color` aesthetic instead of the `fill`.
mtplot = ggplot(mtcars) +
geom_point(aes(x=mpg,y=disp,color=cyl)) +
scale_color_continuous(limits=c(0,8))
#Preview how the plot will look by setting `preview = TRUE`: We also adjust the angle of the light.
if(run_documentation()) {
plot_gg(mtplot, width=3.5, sunangle=225, preview = TRUE)
}
 if(run_documentation()) {
plot_gg(mtplot, width=3.5, multicore = TRUE, windowsize = c(1400,866), sunangle=225,
zoom = 0.60, phi = 30, theta = 45)
render_snapshot()
}
if(run_documentation()) {
plot_gg(mtplot, width=3.5, multicore = TRUE, windowsize = c(1400,866), sunangle=225,
zoom = 0.60, phi = 30, theta = 45)
render_snapshot()
}
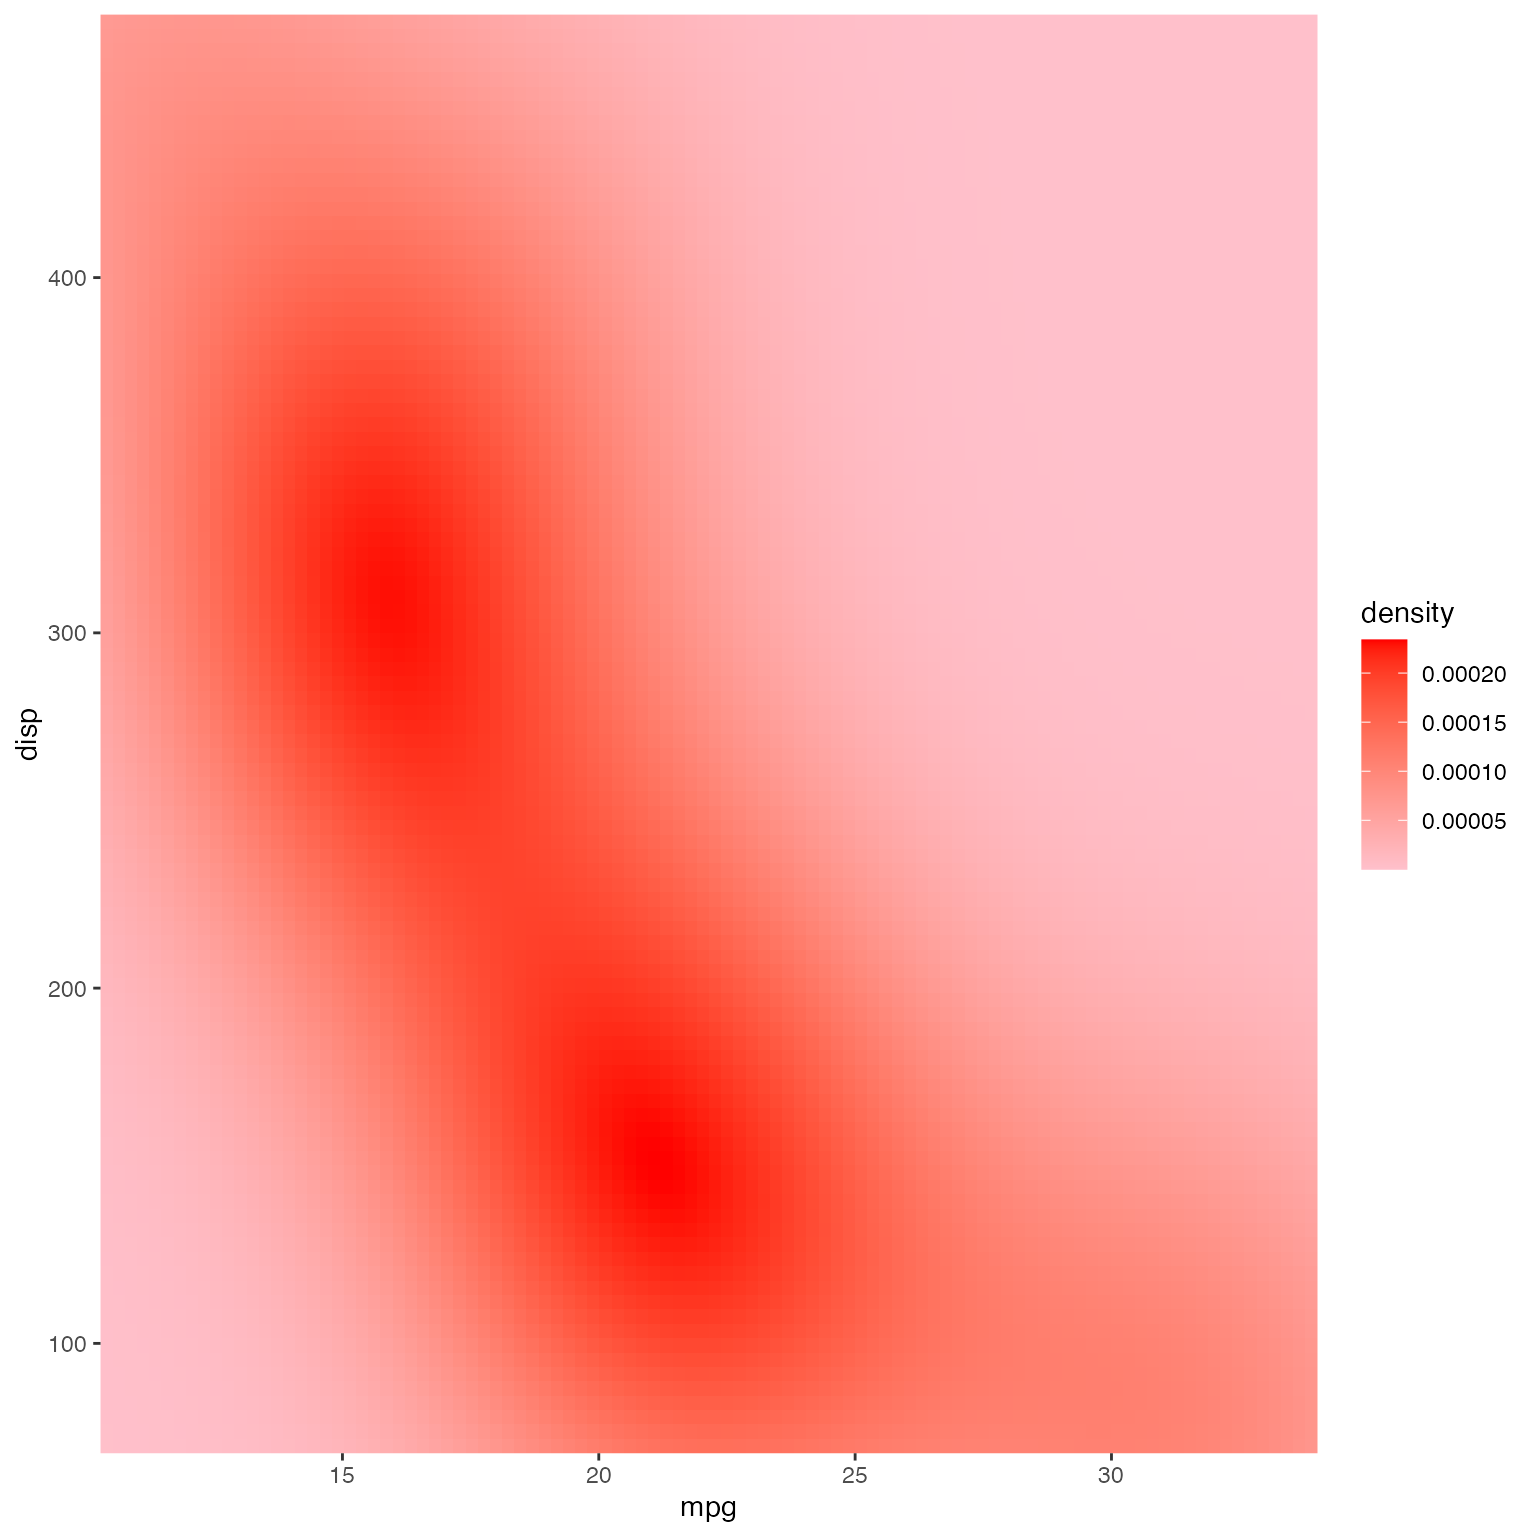
 #Now let's plot a density plot in 3D.
mtplot_density = ggplot(mtcars) +
stat_density_2d(aes(x=mpg,y=disp, fill=after_stat(!!str2lang("density"))),
geom = "raster", contour = FALSE) +
scale_x_continuous(expand=c(0,0)) +
scale_y_continuous(expand=c(0,0)) +
scale_fill_gradient(low="pink", high="red")
mtplot_density
#Now let's plot a density plot in 3D.
mtplot_density = ggplot(mtcars) +
stat_density_2d(aes(x=mpg,y=disp, fill=after_stat(!!str2lang("density"))),
geom = "raster", contour = FALSE) +
scale_x_continuous(expand=c(0,0)) +
scale_y_continuous(expand=c(0,0)) +
scale_fill_gradient(low="pink", high="red")
mtplot_density
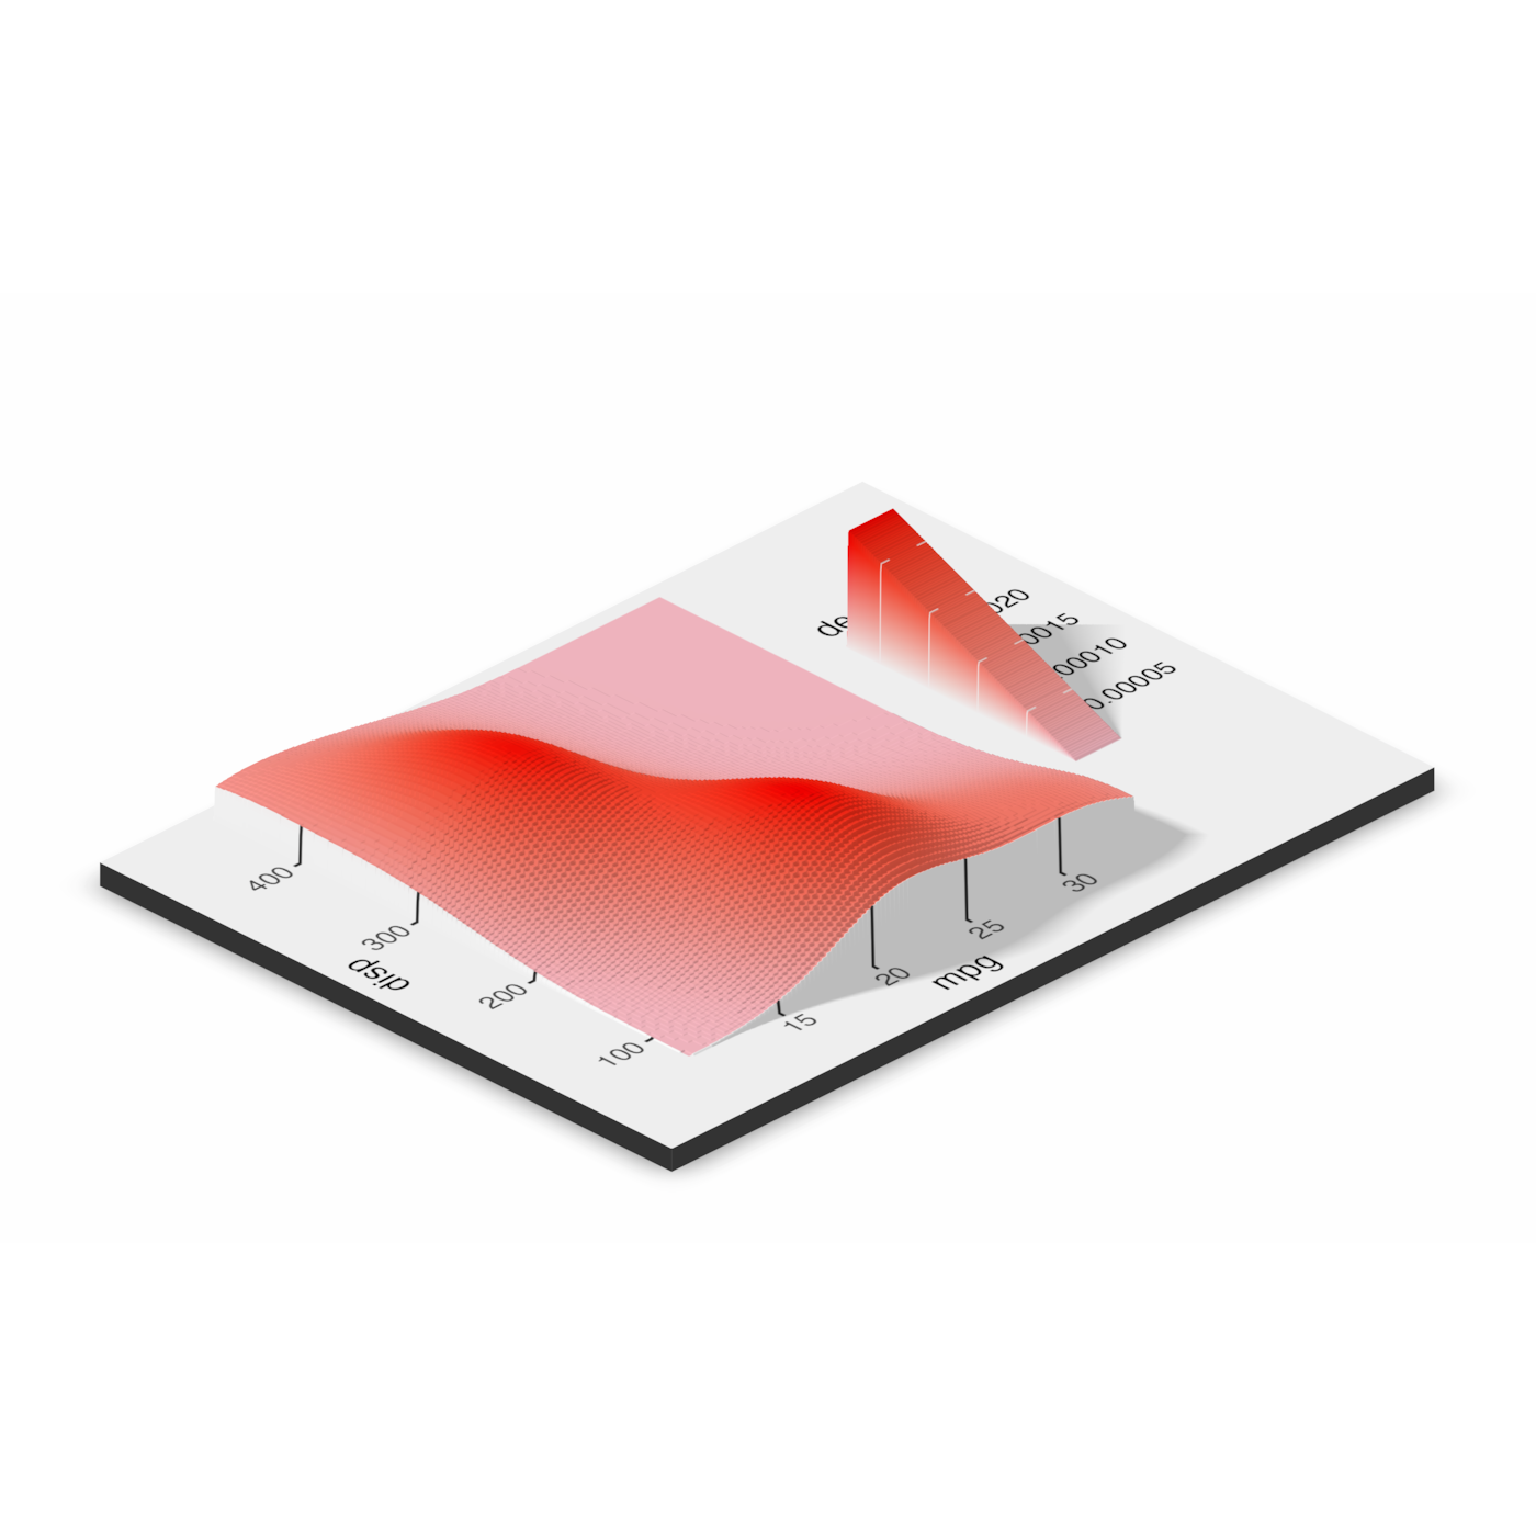
 if(run_documentation()) {
plot_gg(mtplot_density, width = 4,zoom = 0.60, theta = -45, phi = 30,
windowsize = c(1400,866))
render_snapshot()
}
if(run_documentation()) {
plot_gg(mtplot_density, width = 4,zoom = 0.60, theta = -45, phi = 30,
windowsize = c(1400,866))
render_snapshot()
}
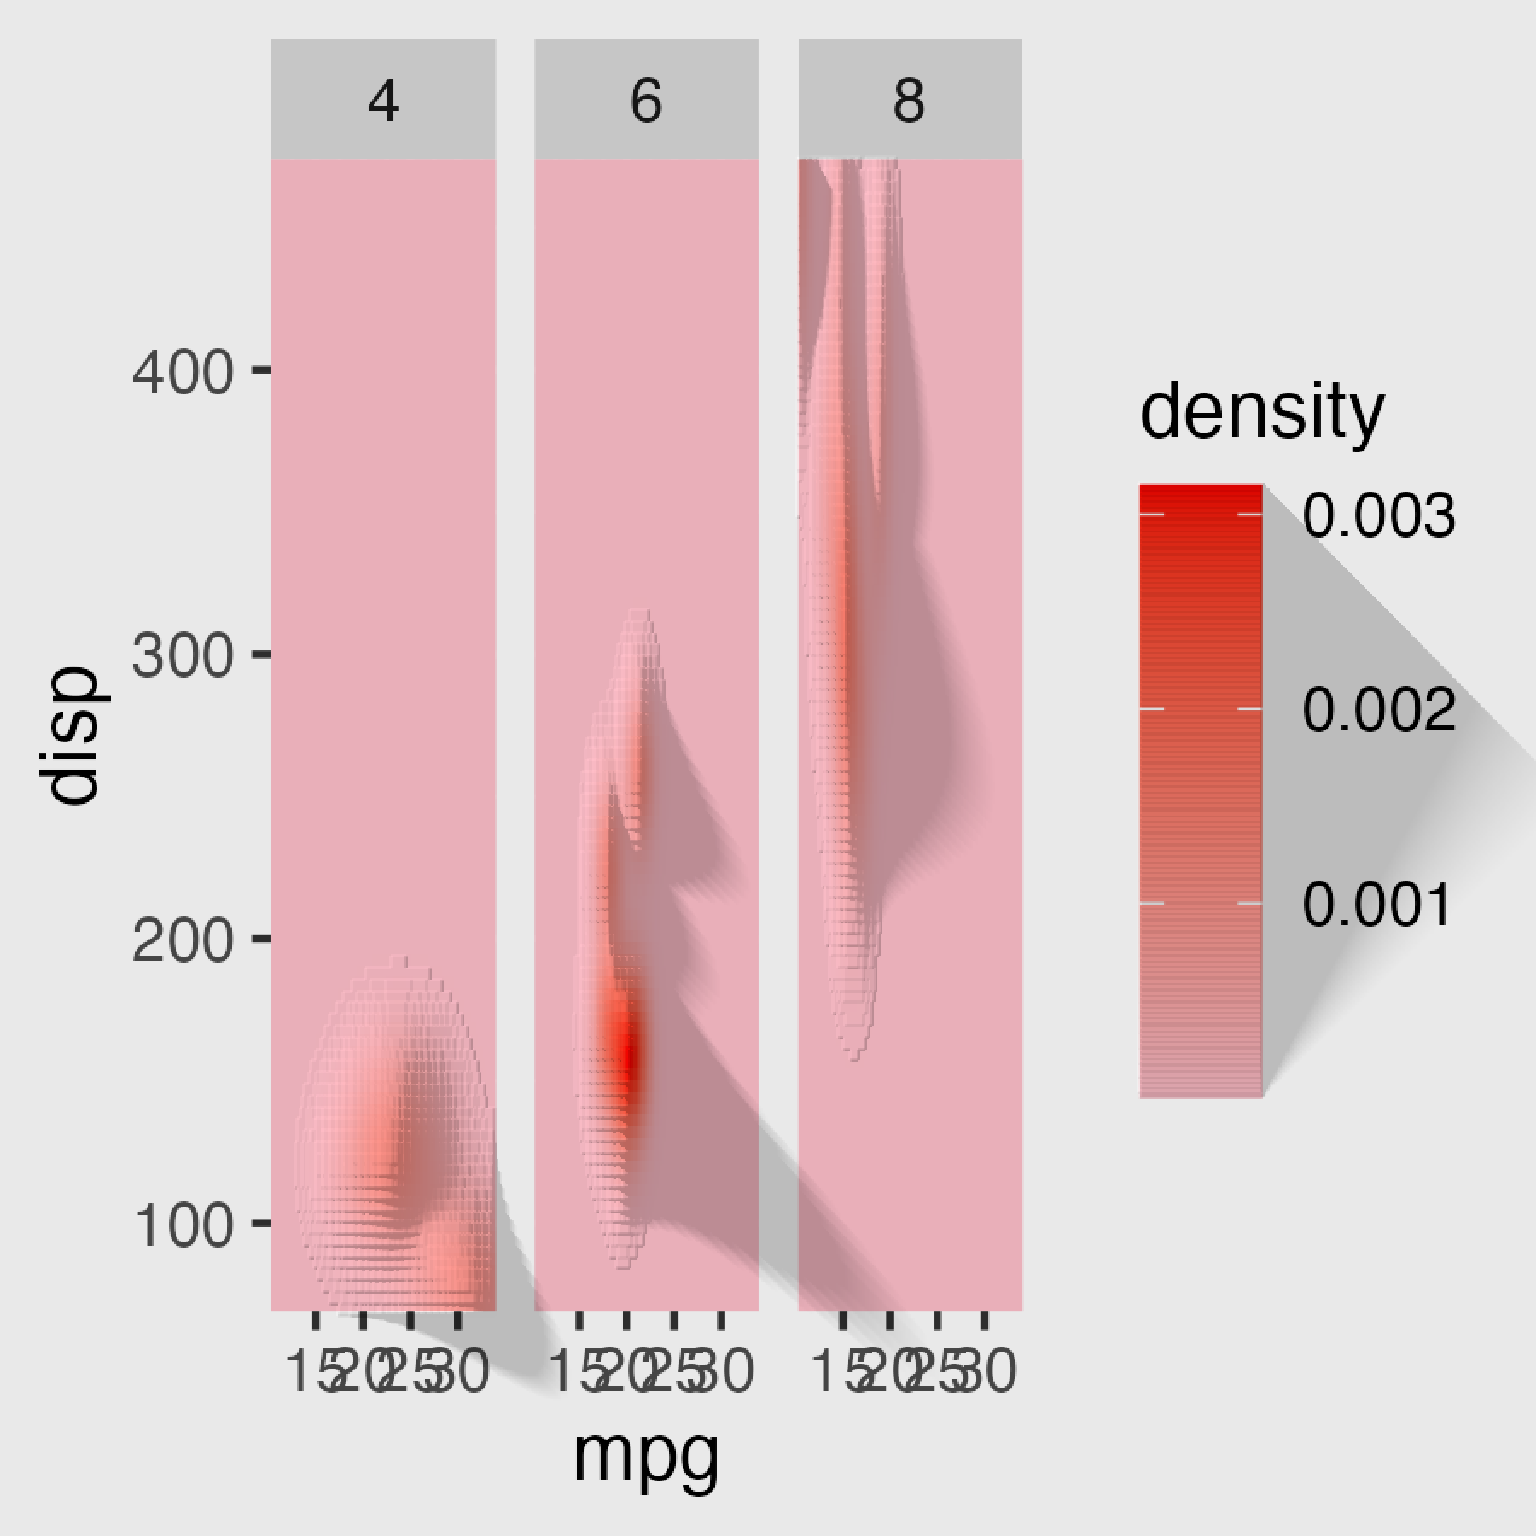
 #This also works facetted.
mtplot_density_facet = mtplot_density + facet_wrap(~cyl)
#Preview this plot in 2D:
if(run_documentation()) {
plot_gg(mtplot_density_facet, preview = TRUE)
}
#This also works facetted.
mtplot_density_facet = mtplot_density + facet_wrap(~cyl)
#Preview this plot in 2D:
if(run_documentation()) {
plot_gg(mtplot_density_facet, preview = TRUE)
}
 if(run_documentation()) {
plot_gg(mtplot_density_facet, windowsize=c(1400,866),
zoom = 0.55, theta = -10, phi = 25)
render_snapshot()
}
if(run_documentation()) {
plot_gg(mtplot_density_facet, windowsize=c(1400,866),
zoom = 0.55, theta = -10, phi = 25)
render_snapshot()
}
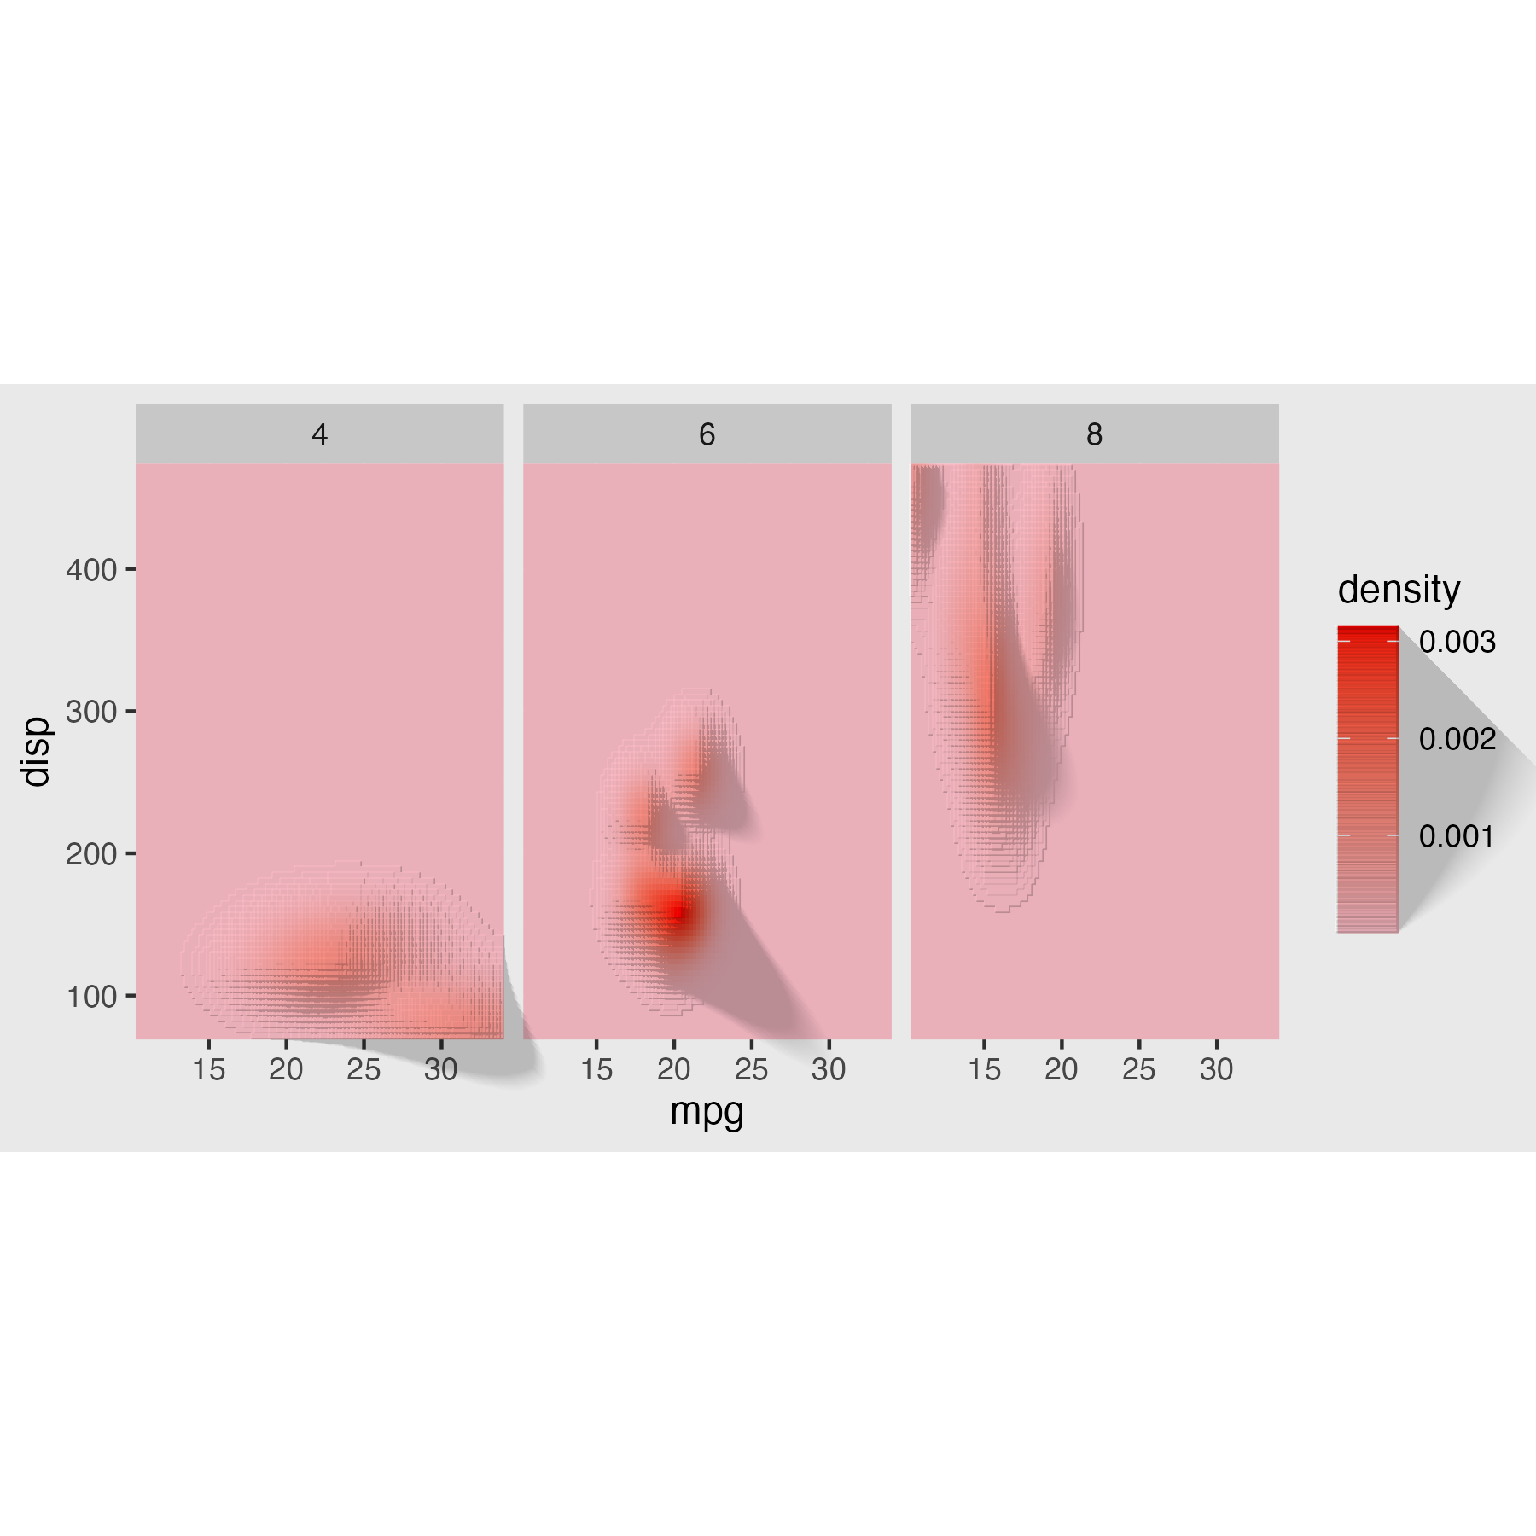
 #That is a little cramped. Specifying a larger width will improve the readability of this plot.
if(run_documentation()) {
plot_gg(mtplot_density_facet, width = 6, preview = TRUE)
}
#That is a little cramped. Specifying a larger width will improve the readability of this plot.
if(run_documentation()) {
plot_gg(mtplot_density_facet, width = 6, preview = TRUE)
}
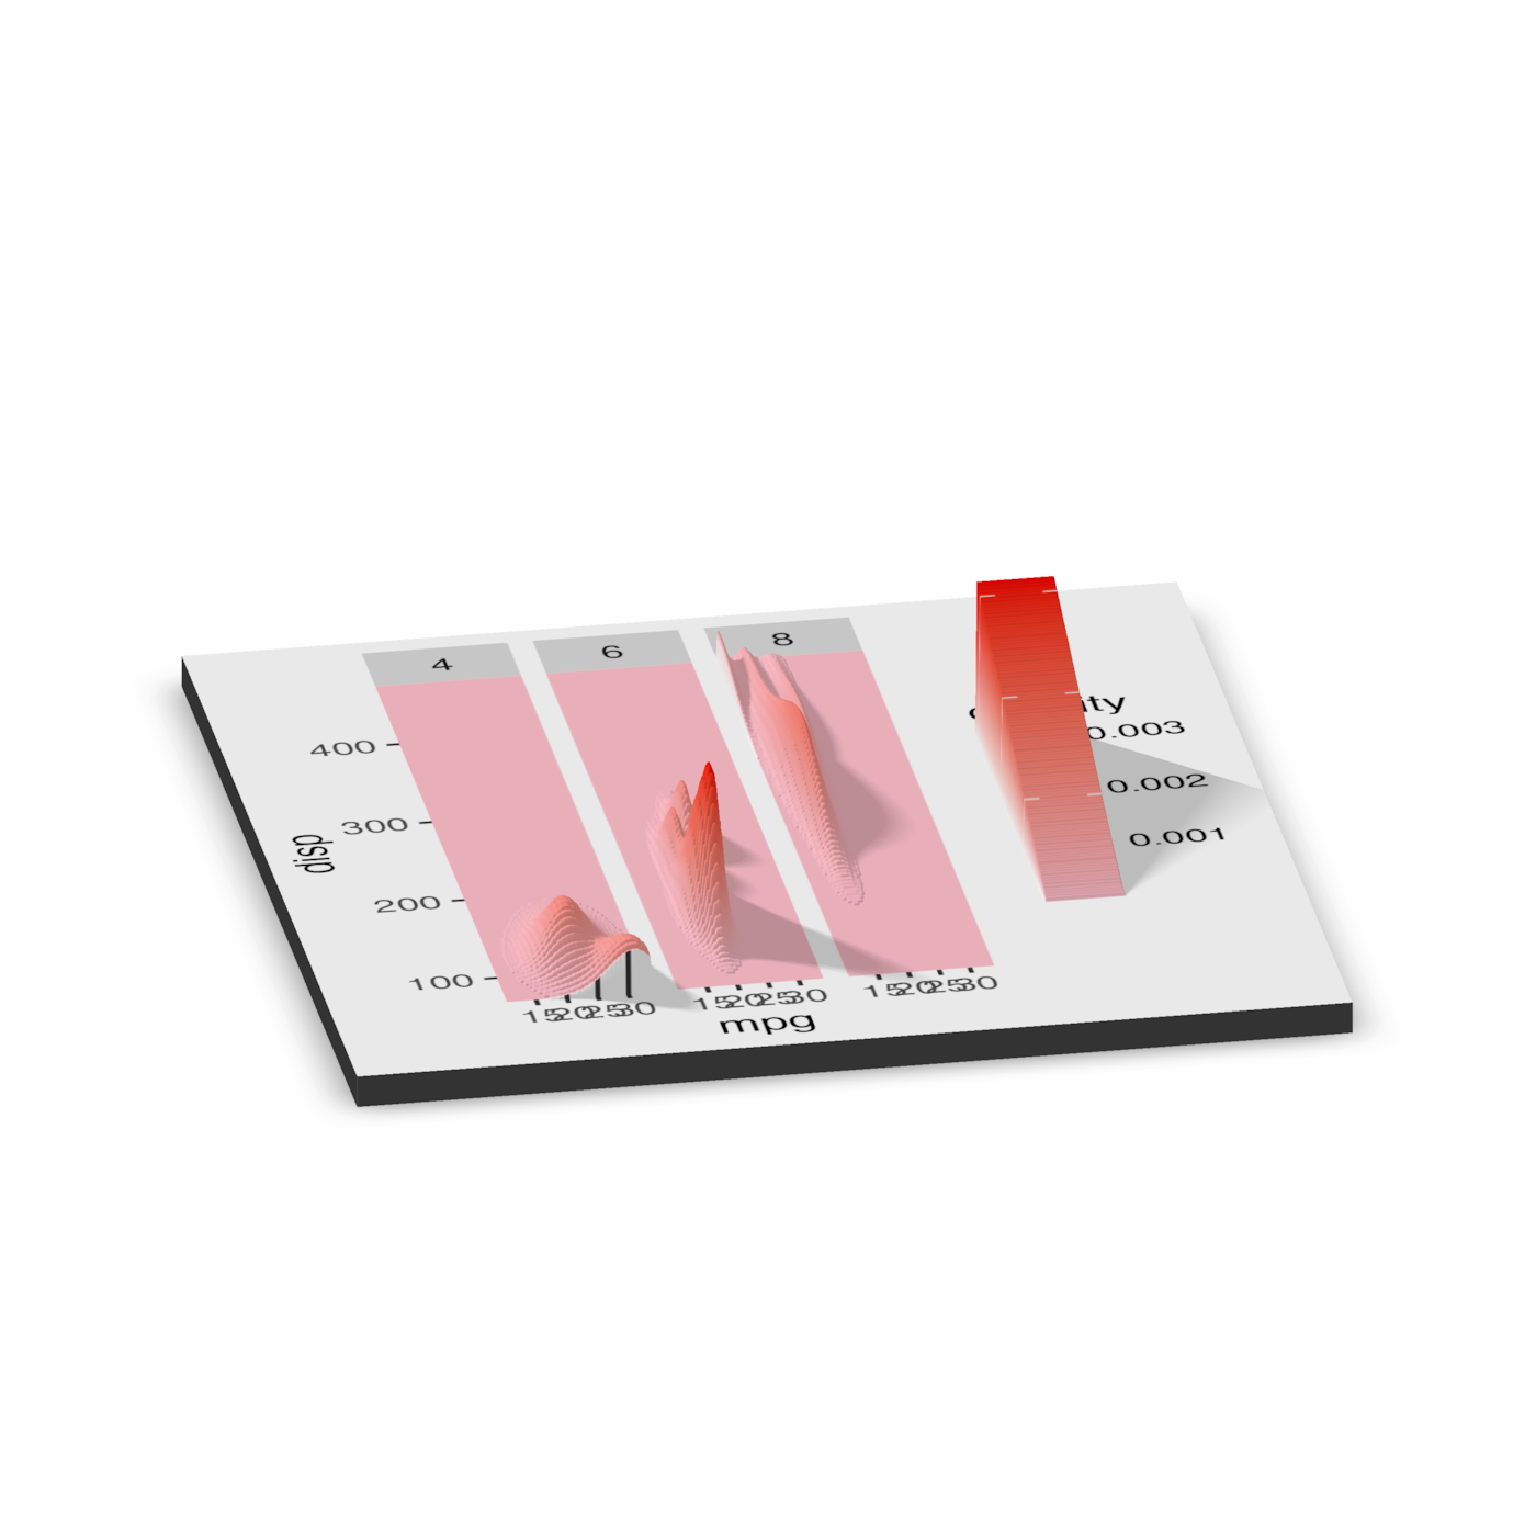
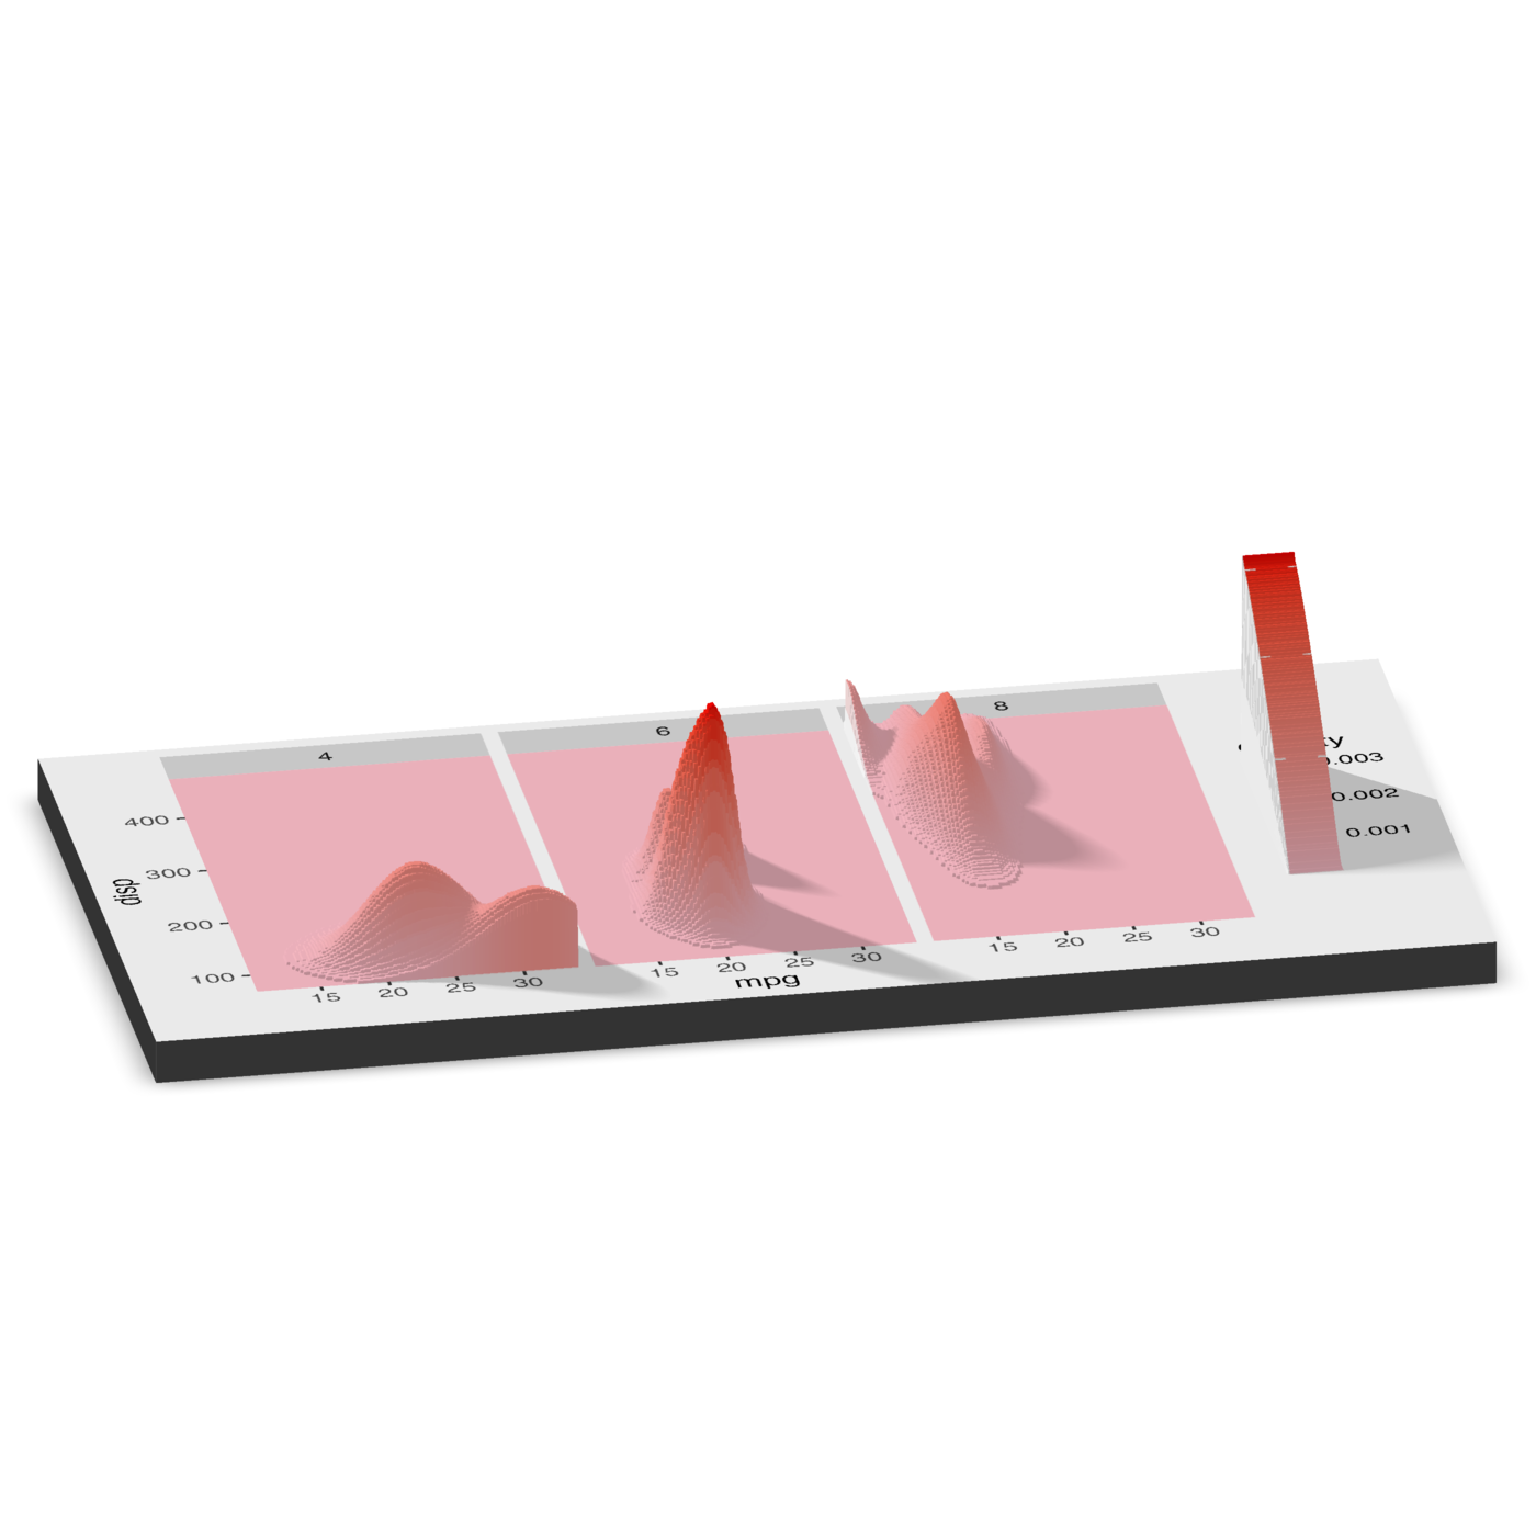
 #That's better. Let's plot it in 3D, and increase the scale.
if(run_documentation()) {
plot_gg(mtplot_density_facet, width = 6, windowsize=c(1400,866),
zoom = 0.55, theta = -10, phi = 25, scale=300)
render_snapshot()
}
#That's better. Let's plot it in 3D, and increase the scale.
if(run_documentation()) {
plot_gg(mtplot_density_facet, width = 6, windowsize=c(1400,866),
zoom = 0.55, theta = -10, phi = 25, scale=300)
render_snapshot()
}
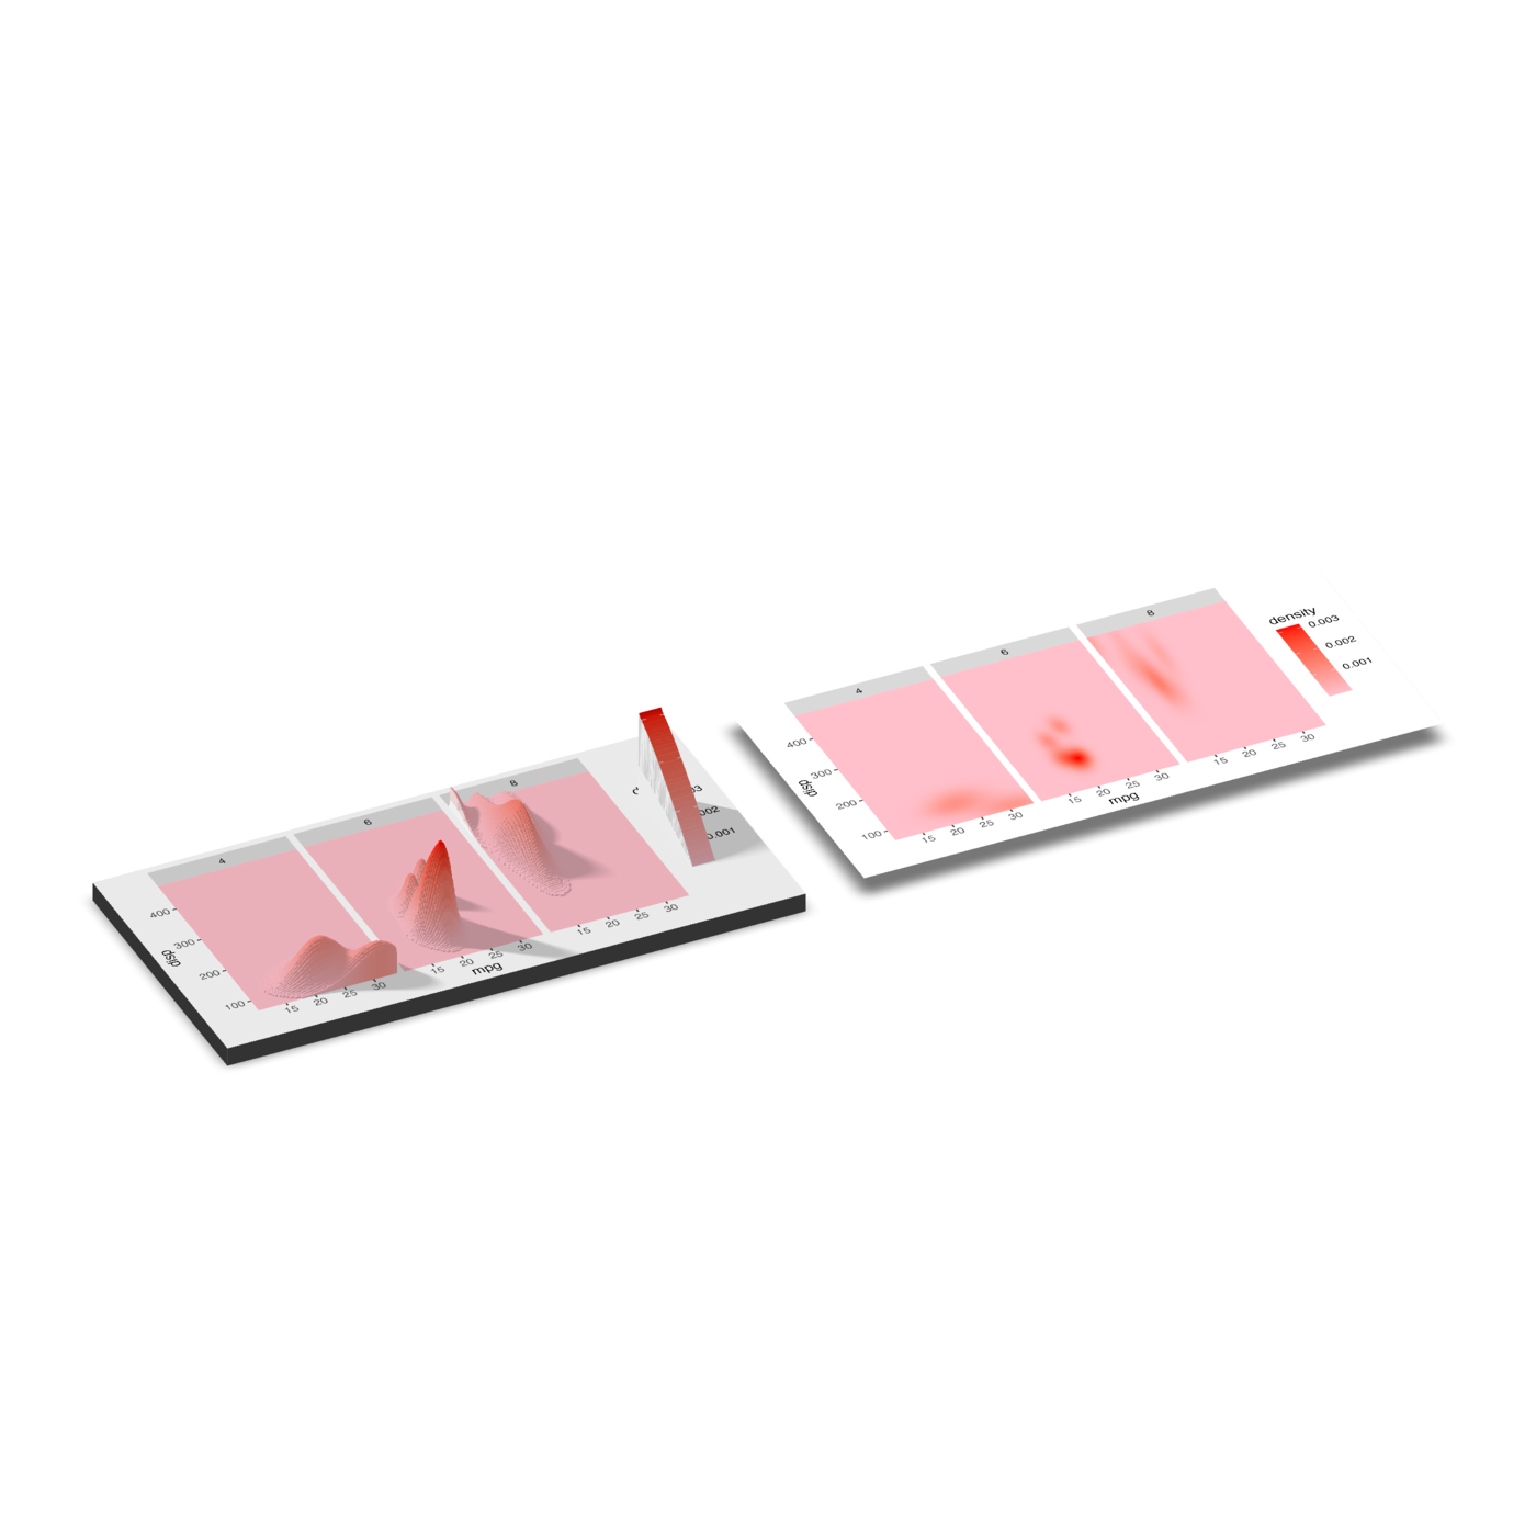
 #We can also render a flat version of the plot alongside (or above/below) the 3D version.
if(run_documentation()) {
plot_gg(mtplot_density_facet, width = 6, windowsize=c(1400,866),
zoom = 0.65, theta = -25, phi = 35, scale=300, flat_plot_render=TRUE,
flat_direction = "x")
render_snapshot()
}
#We can also render a flat version of the plot alongside (or above/below) the 3D version.
if(run_documentation()) {
plot_gg(mtplot_density_facet, width = 6, windowsize=c(1400,866),
zoom = 0.65, theta = -25, phi = 35, scale=300, flat_plot_render=TRUE,
flat_direction = "x")
render_snapshot()
}